
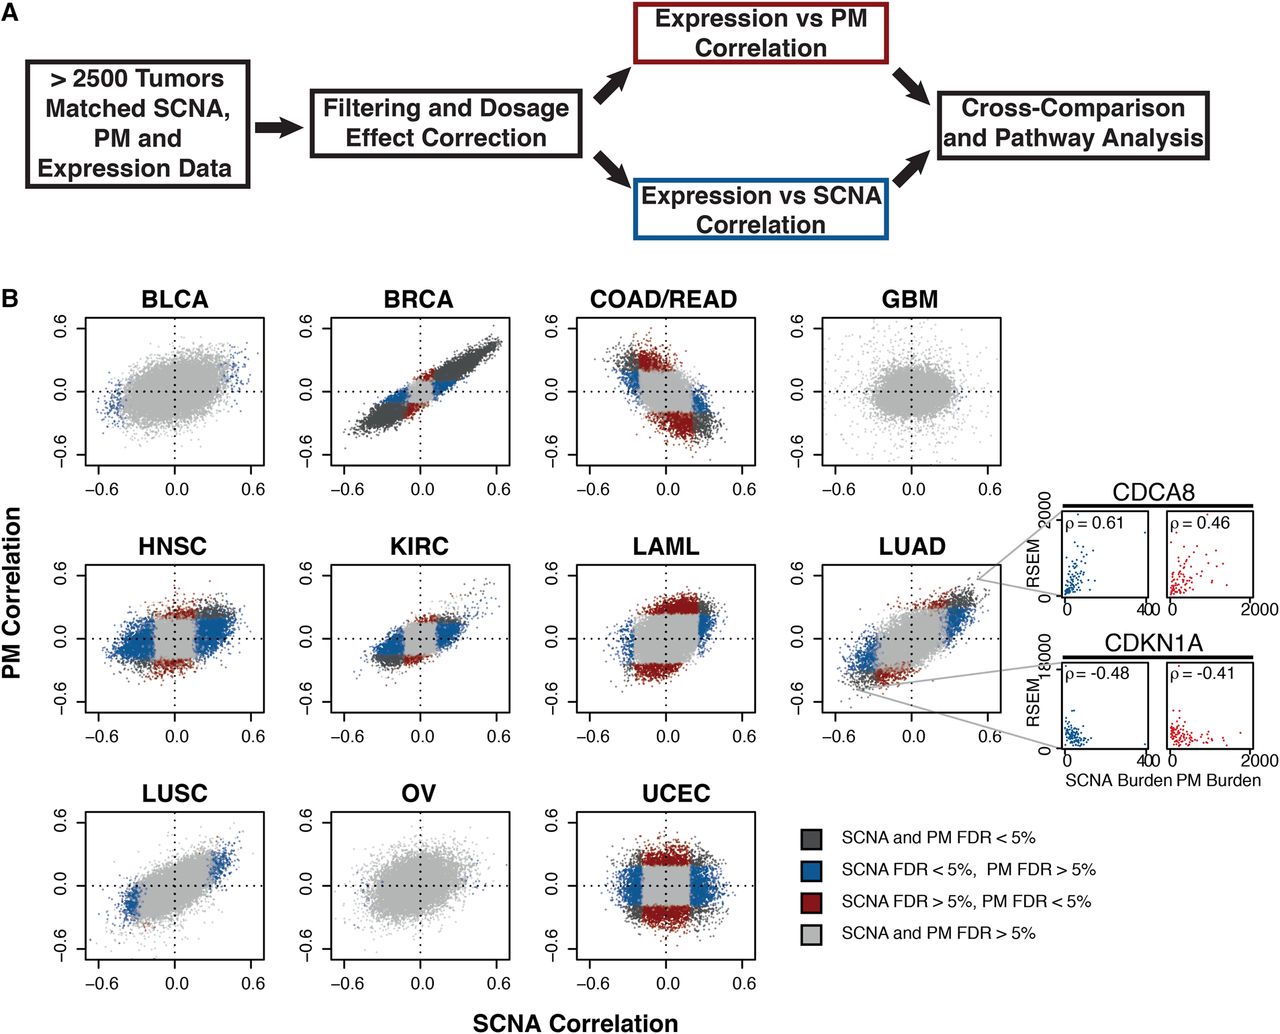
Comparative correlative analysis between gene expression, exonic PM burden, and SCNA burden. (A) Summary of correlation analysis workflow. (B) Gene-wise comparisons between SCNA burden (x-axis) and PM burden (y-axis). Shown are Spearman correlations across 11 tumor types from TCGA. Tumor type: bladder carcinoma (BLCA), breast carcinoma (BRCA), colon/rectal carcinoma (COAD-READ), glioblastoma (GBM), head and neck squamous cell carcinoma (HNSC), renal carcinoma (KIRC), acute myeloid leukemia (LAML), lung adenocarcinoma (LUAD), lung squamous cell carcinoma (LUSC), ovarian carcinoma (OV), and uterine cervix endometrial carcinoma (UCEC). Gray: FDRPM > 5% and FDRSCNA > 5%; blue: FDRPM > 5% and FDRSCNA < 5%; red: FDRPM < 5% and FDRSCNA > 5%; black: FDRPM < 5% and FDRSCNA < 5%. Representative correlation plots between variant burdens and expression shown in side panels. Colors represent specified FDR cutoffs (see legend). Representative examples of genes whose expression (RSEM, RNA-seq by expectation maximization values) are positively (CDCA8) or negatively (CDKN1A) correlating with SCNA or PM burden are shown in the side panel.


