
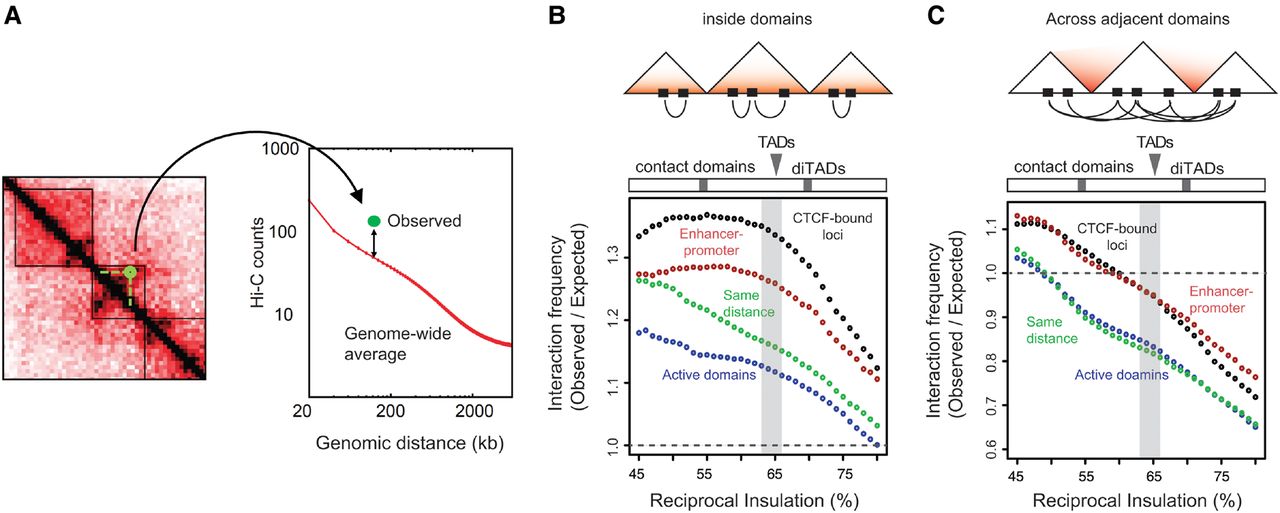
TADs define a scale where promoter-enhancer communication is optimal in ESCs. (A) Schematics of contact enrichment analysis. For each pair of loci, we calculated the ratio between observed Hi-C counts and the genome-wide average counts for loci located at the same genomic distance. (B) Enrichment in interactions between pairs of loci belonging to the same domain, as a function of reciprocal insulation. Colors refer to random loci within active TADs (blue), enhancer-promoter pairs (red), random loci with the same distance distribution as enhancer-promoter pairs (green), and CTCF-containing loci (black). Median enrichment over all pairs of considered loci are plotted. Gray shaded area indicates the 63%–66% confidence interval where maximal coregulation of genes occurs in partially reshuffled genomes (cf. Supplemental Fig. S3b). (C) Enrichment (or depletion) in interactions between pairs of loci, defined as in panel A but located across consecutive domains. Gray shaded area as in panel B.


