
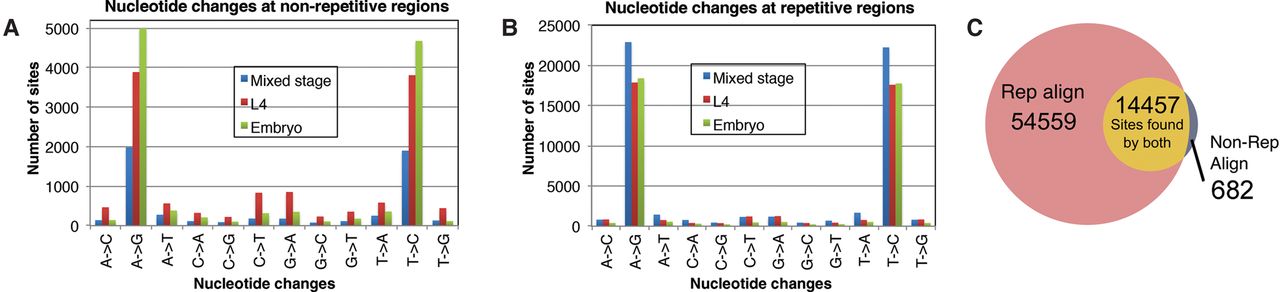
Figure 2.
Nucleotide changes found by the computational pipeline. Bar graphs represent nucleotide changes found by using the computational pipeline at nonrepetitive regions (A) or repetitive regions (B). A-to-G and T-to-C changes (from antiparallel transcripts) indicate possible RNA editing sites. Sites found in mixed-stage worms (blue), embryos (green), and L4 larval stage (red). (C) A Venn diagram presenting the intersection between A-to-I editing sites found by repetitive (Rep align) and nonrepetitive alignments (Non-Rep align). Most of the nonrepetitive sites were also found by the repetitive analysis.


