
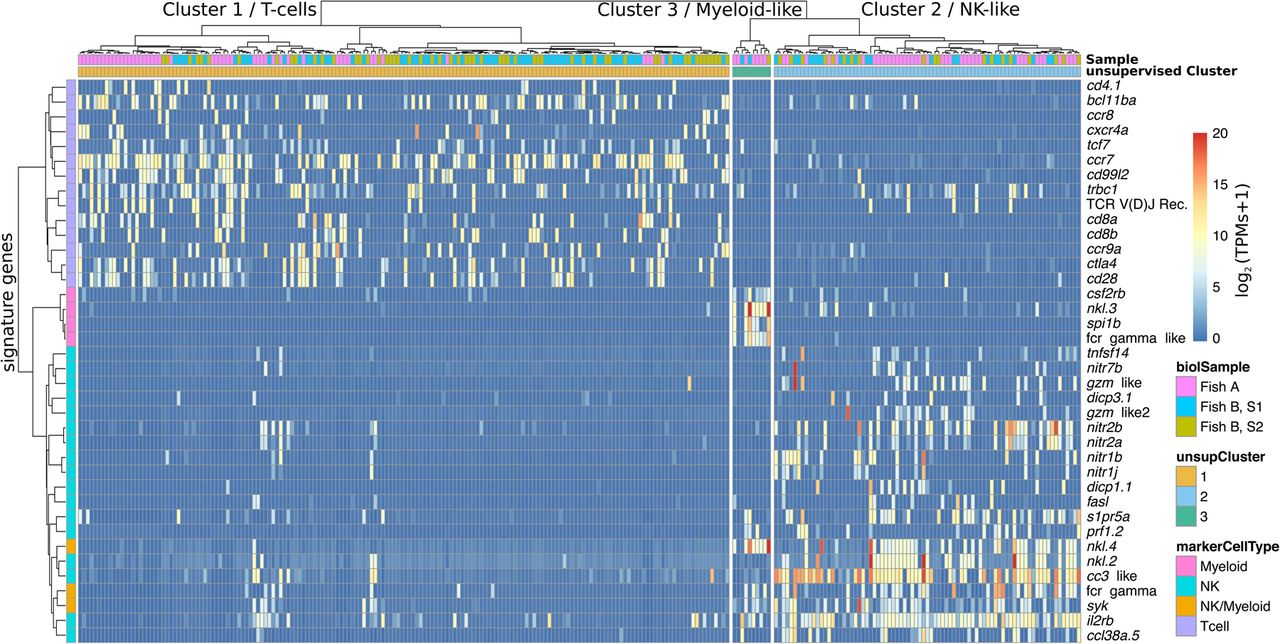
Heatmap showing the expression levels of important differentially expressed marker genes. Columns and rows represent cells and marker genes, respectively. Colors of the columns show the plates (top row) and the assigned clusters for each cell based on unsupervised whole-transcriptome clustering (second row; dendrogram shown on top). Colors of the rows (left-most column) indicate the known function of marker genes based on the literature (T-cell, NK, or myeloid marker). The heatmap color scale indicates the log2 TPMs (see Methods). Apart from a few cells in the T-cell cluster that show expression of NK markers, the unsupervised whole-transcriptome clustering is very well recapitulated by expression of known and putative cell-type markers.


