
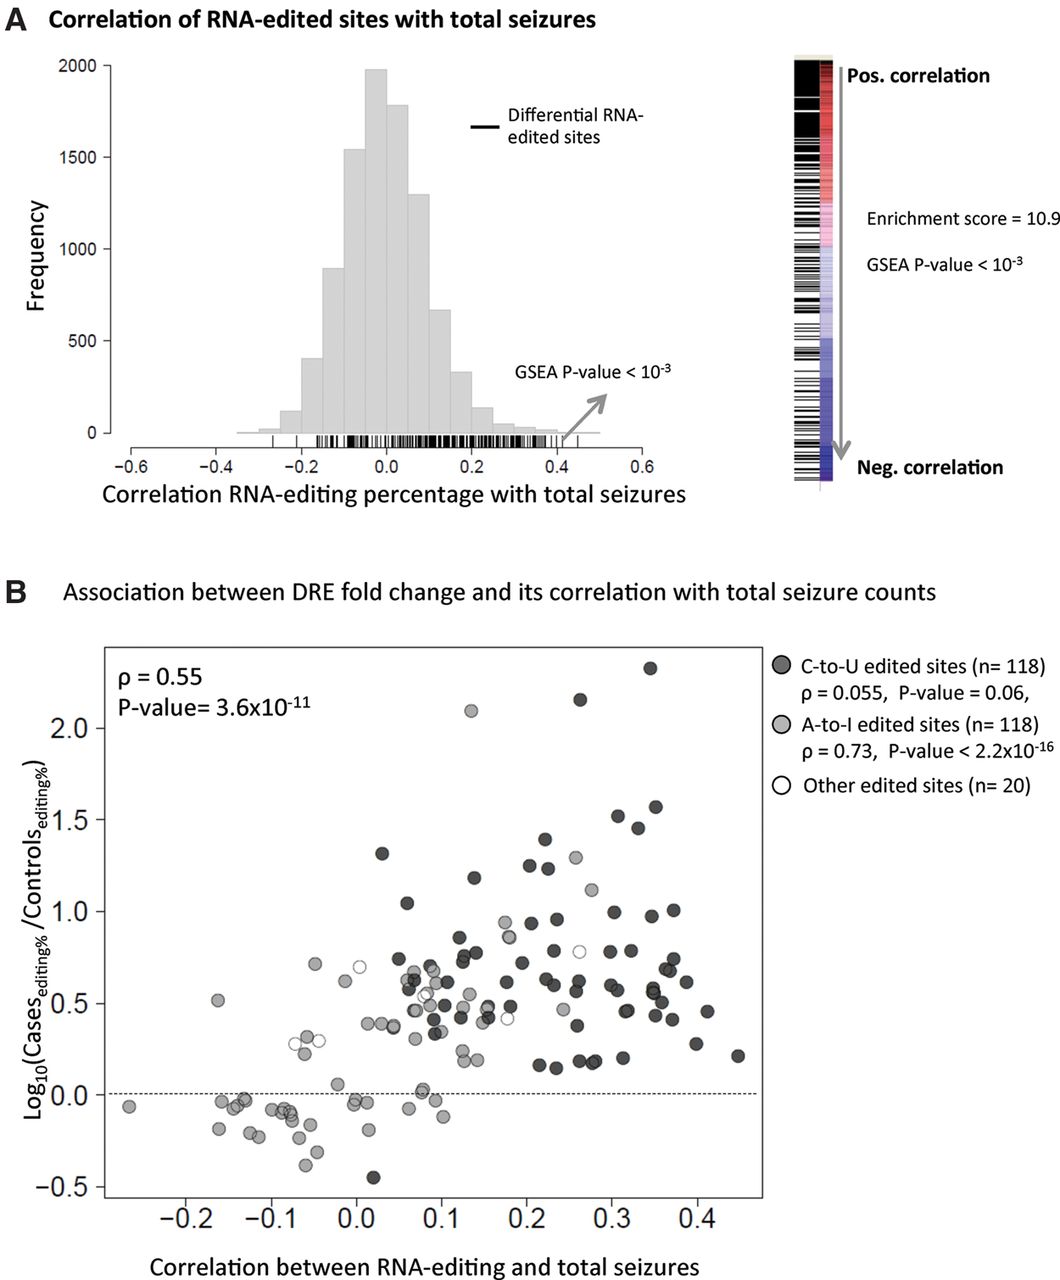
Figure 3.
Relationship between RNA editing in the hippocampus and seizure frequency (here, measured as total seizure counts over a standardized period of 14 continuous days of monitoring). (A) Correlation between RNA-editing percentages and total seizure counts in the 100 epileptic mice. (B) Association between RNA-editing fold change and correlation between RNA-editing percentage and total seizures in epileptic mice. C-to-U sites are represented as solid black circles, while A-to-I sites are solid gray circles. All other sites are represented as white circles with a black outline.


