
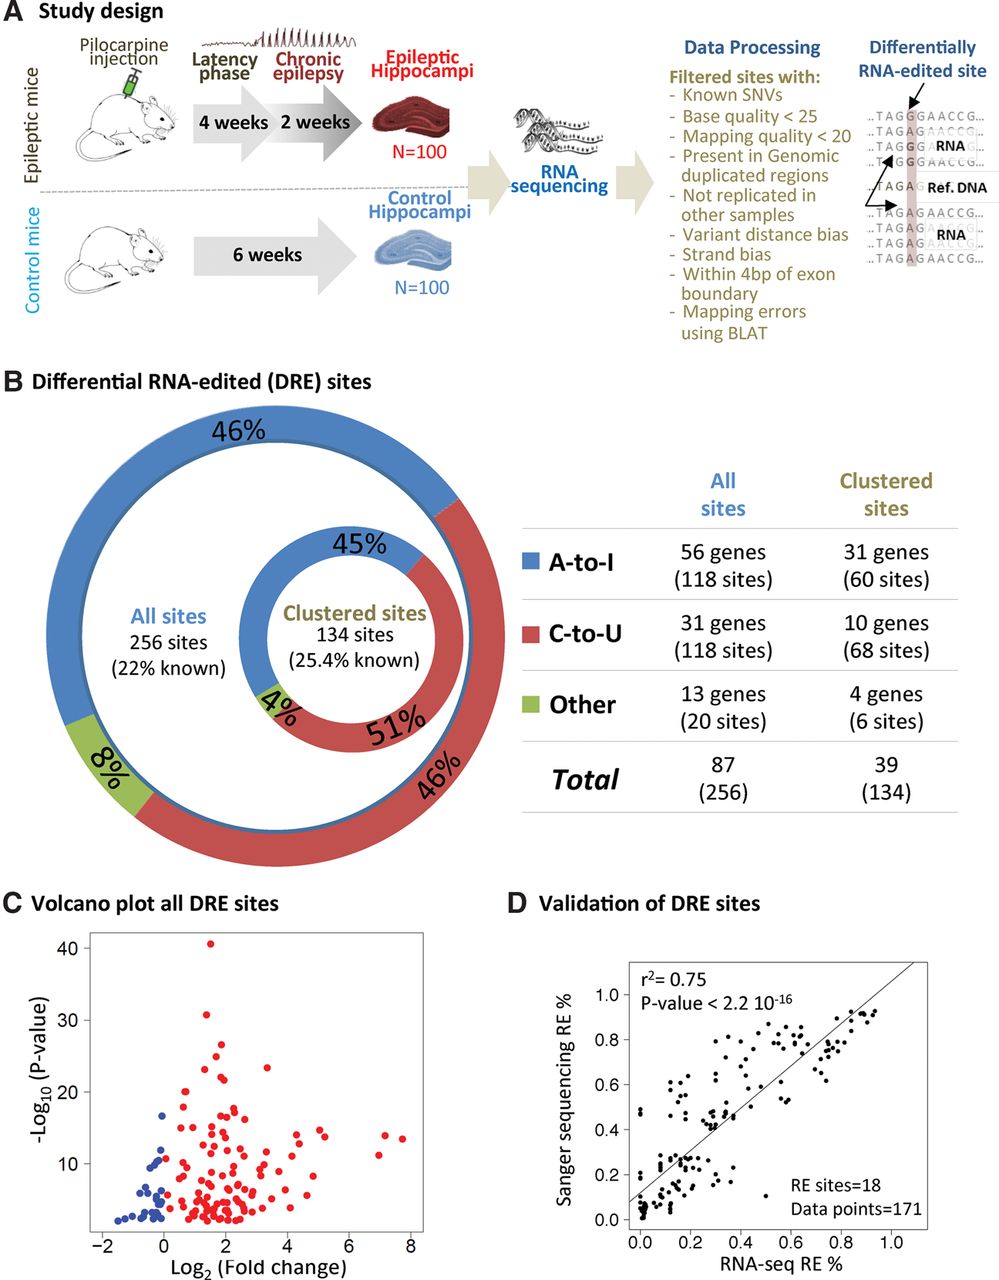
(A) Summary of study design for detecting significant differential RNA editing events associated with epilepsy. (B) The figure summarizes the results for the different categories of differential RNA editing analyzed. These categories were generated using two approaches: (1) predicted RNA-editing sites, represented in the outer circle, and (2) predicted and clustered RNA-edited sites, represented in the inner circle and table. The percentages were calculated with respect to unique genes. The outer circle refers to “all” sites, while the inner circle refers to “clustered” sites. A-to-I and C-to-U editing are represented in blue and red, respectively, while all other sites are represented in green. (C) Volcano plot summarizing mean RNA-editing percentages differences in epileptic and control mice and their significance levels. (D) Concordance between RNA-editing events detected using RNA-seq and Sanger sequencing.


