
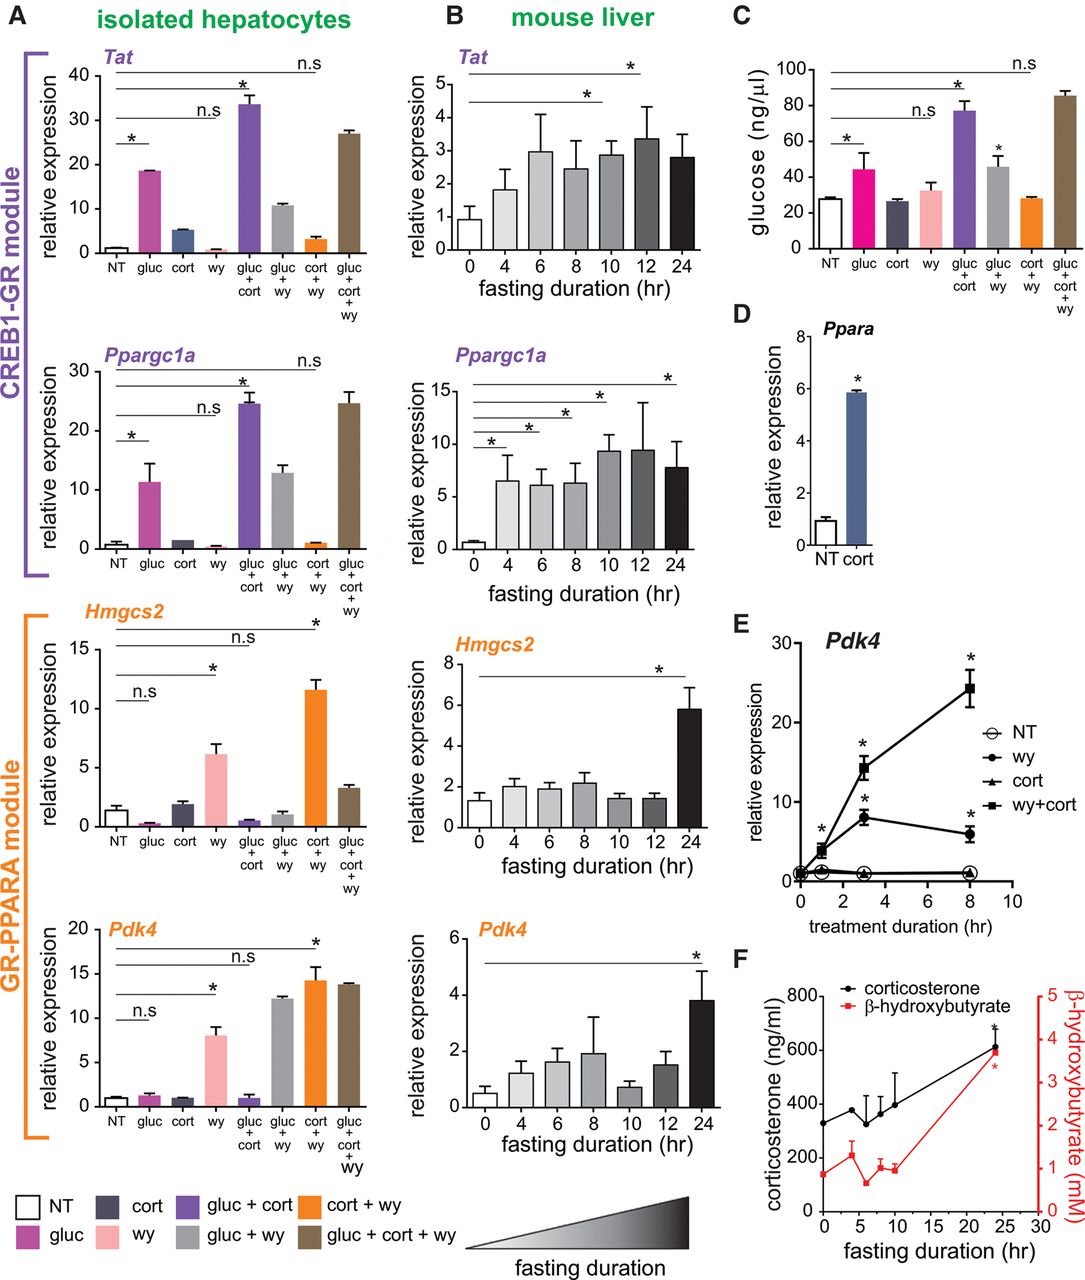
The transcriptional response to fasting in liver is comprised of two TF modules. (A) Nascent RNA levels of fasting-induced genes in primary hepatocytes following a 3-h treatment with different combinations of glucagon (gluc), corticosterone (cort), and WY-14643 (wy). (B) Time course of fasting-induced genes shows an early induction of gluconeogenic genes and a later induction of FAO/ketogenic genes in liver. (C) Glucose production in primary hepatocytes following treatment with different combinations of glucagon, corticosterone, and WY-14643. (D) Nascent RNA levels of Ppara following corticosterone treatment (3 h) in primary hepatocytes. (E) Nascent RNA levels of Pdk4 in primary hepatocytes following 1, 3, and 8 h of treatment with different combinations of WY-14643 and corticosterone: (*) statistical significance (P ≤ 0.05) compared to a nontreated sample (NT) in each time point. (F) Time course of serum corticosterone and β-hydroxybutyrate levels during fasting: (*) statistical significance (P ≤ 0.05) compared to control values (fed). (n.s.) Not significant.


