
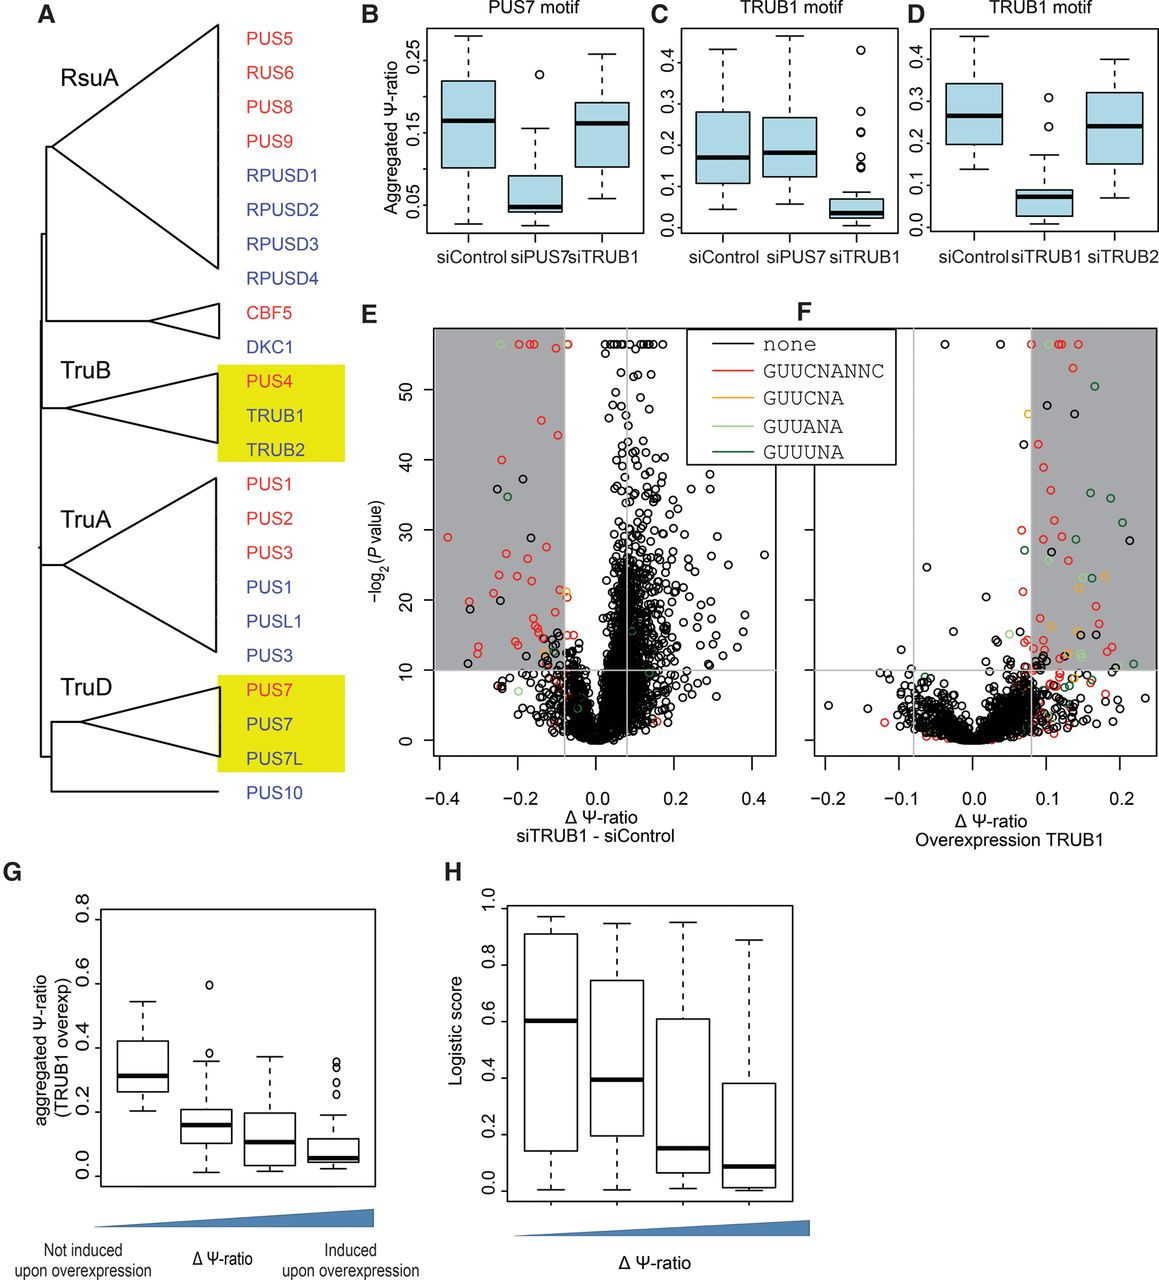
Genetic perturbations reveal proteins catalyzing Ψ at PUS7 and TRUB1 mRNA targets. (A) Phylogenetic tree of all human and yeast proteins comprising a PUS domain. Multiple alignments and trees were generated using MAFFT. Nodes were collapsed to highlight the classification of PUS domain families in bacteria, which are indicated when available. (B) Distribution of Ψ-ratios for sites containing a PUS7-like motif (n = 13) measured following knockdown of PUS7, TRUB1, or mock knockdown in HEK293 cells. Experiments were performed at least in replicates; putative peaks were identified based on the full data set (Methods), following which an aggregated Ψ-ratio was calculated for each site, defined as the number of reads from all replicates terminating at the site, divided by all reads overlapping it. (C) Analysis as in B but for sites harboring a TRUB1 consensus motif (n = 49). Panels B and C are based on the same experimental data set. (D) Distribution of Ψ-ratios for sites containing a TRUB1 motif (n = 14) following knockdown of either TRUB1 or TRUB2, or mock knockdown. (E) Volcano plot depicting the difference in Ψ-ratio between TRUB1 knockdown and mock knockdown cells (x-axis) and the associated t-test-derived P-value based on triplicates in each condition (y-axis) for each of the putative Ψ positions. Sites harboring a TRUB1 consensus sequence, or derivatives thereof, are colored as indicated. (F) Volcano plot, as in E. Differences in Ψ-ratios following overexpression of TRUB1 and Ψ-ratios following TRUB2 overexpression (used as a proxy for a negative control) are plotted. (G) Distribution of aggregated Ψ-ratios measured in the TRUB1 overexpression samples, plotted as a function of the difference in Ψ-ratios in samples overexpressing TRUB1 versus TRUB2. (H) Distributions of logistic regression-based pseudouridylation scores across sites that are induced following overexpression, divided into four bins as in Figure 2E.


