
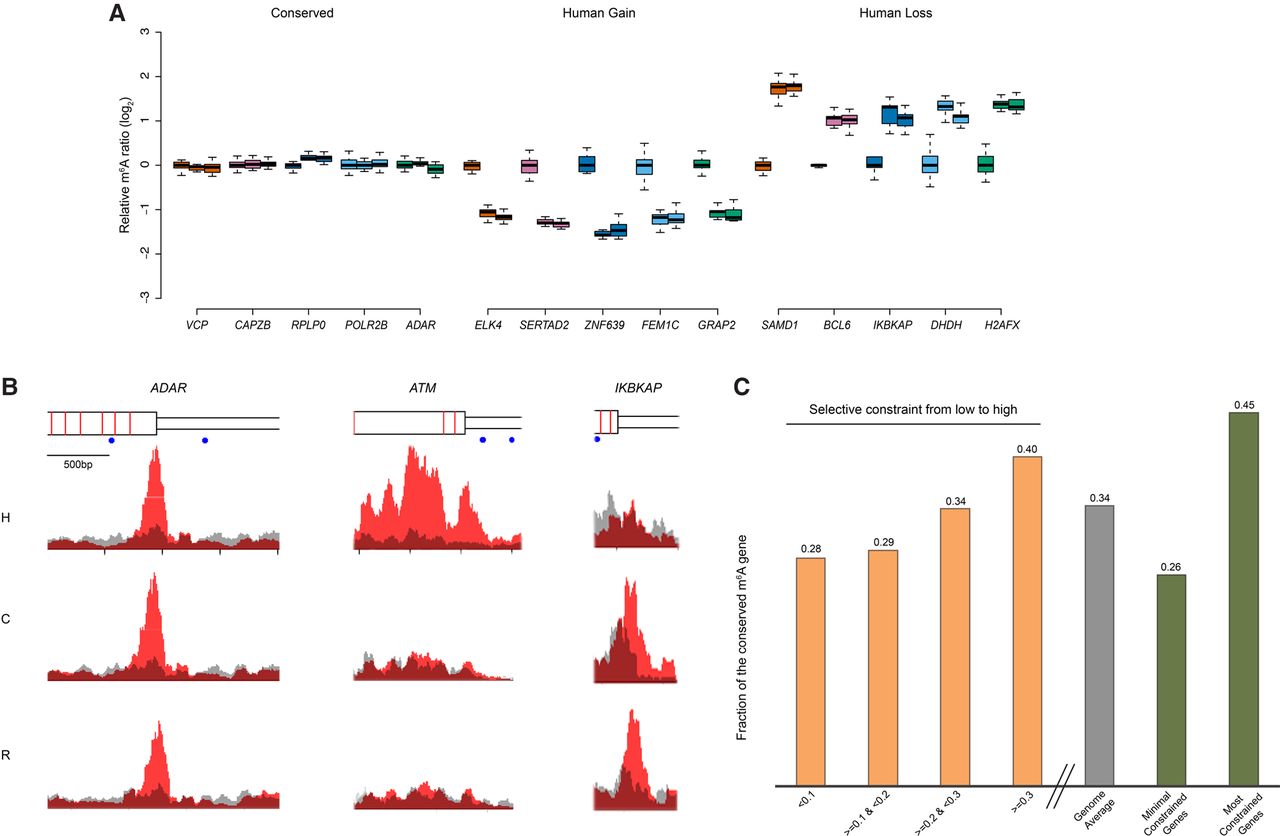
The evolution of m6A modification. (A) The top five genes from the groups of “conserved,” “human gain,” and “human loss” are presented as examples. The m6A signals in the “conserved” group show low variation both within and between species, following the pattern of stabilizing selection. The “human gain” and “human loss” represent m6A modifications specifically changed in human lineage, which follow the pattern of directional selection. Data points from all biological replicates were included. The m6A signals of each biological replicate from chimpanzee and rhesus were normalized to the mean of enrichment score of all human experiments, and the log2 ratio was plotted in the y-axis to represent differential m6A signals between species. For each gene, from left to right represented human, chimpanzee, and rhesus. (B) m6A-IP and input signals were plotted. We chose one example from each of the three categories. Signals on the transcripts of ADAR (adenosine deaminase, RNA-specific), ATM (ATM serine/threonine kinase), and IKBKAP (inhibitor of kappa light polypeptide gene enhancer in B cells, kinase complex-associated protein) represent “conserved,” “human gain,” and “human loss,” respectively. Red represents m6A-IP signal; gray, input. From the top to the bottom: gene structure (wider rectangle indicates exon; narrow rectangle, UTR; red bar, exon boundary; blue dot, GGACT motif), human signal, chimpanzee signal, and rhesus signal. (C) Human m6A-modified genes were split into different groups according to the selective constraint defined in the ExAC (Exome Aggregation Consortium) data (see Methods). With the increase of selective constraint, we observed the increased percentage of conserved m6A modifications. (Four yellow bars) Q1, Q2, and Q3 represented the quartiles of Z-scores defined by ExAC; the lower the Z-scores, the less the selective constraint. (Gray bar) Genome average (N = 5940). (Two green bars) The minimal constrained genes (N = 296) and the most constrained genes (N = 780).


