
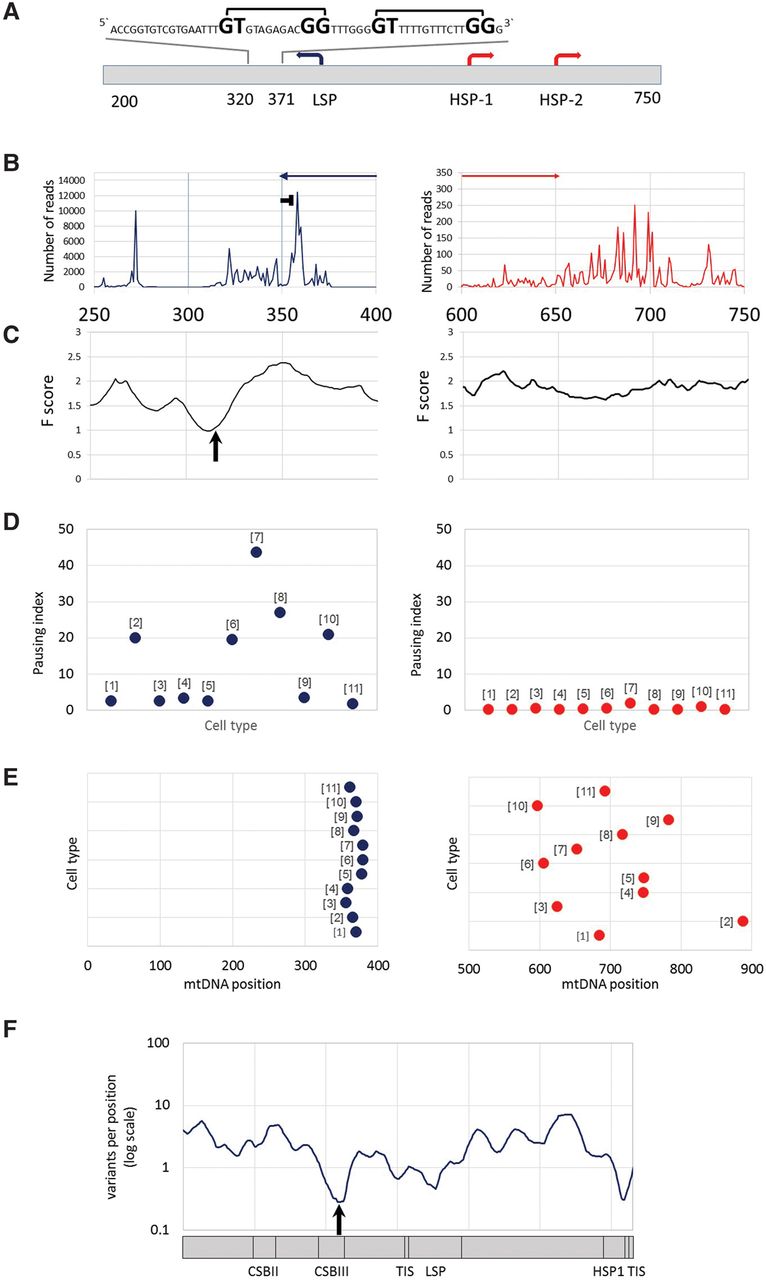
mtDNA transcription consistently pauses at distinct sites near the heavy- and light-strand TIS. (A) mtDNA transcriptional regulation elements. Presented is the complementary human sequence of the light mtDNA strand. The mtDNA sequence around the pausing peak is above the illustrated graph. (Square bracket) The bacterial pausing motif. The mandatory nucleotides within the motif are highlighted by a larger font size. (B) Coverage of the 3′ end of the PRO-seq experiment from K562 cell line. (x-axis) mtDNA nucleotide position; (y-axis) number of reads in the 3′. (Blue and red arrows) The direction of the light- and heavy-strand transcription, respectively. The “horizontal T” sign represents the pausing site. (C) DNase-seq experiment from K562 cell line. (x-axis) mtDNA nucleotide position; (y-axis) F-score of DNase-seq analysis. The lower the score, the more protected is the DNA by proteins. The black arrow points to the DGF site. (D) Pausing index across human cell types. (Left) Light strand; (right) heavy strand. (y-axis) Pausing index values. Dots correspond to the calculated pausing index for each tested cell line (indicated as numbers in brackets near the dots: [1] AC16; [2] CD4+; [3] GM12004; [4] GM 12750; [5] GM12878; [6] HeLa; [7] IMR90; [8] Jurkat; [9] K562; [10] MCF7; [11] U2OS). (E) Pausing site nucleotide position across human cell types. (Left) Light strand; (right) heavy strand; (x-axis) mtDNA position. Dots correspond to the pausing site nucleotide position of each tested cell line (numbering as in D). (F) Human population SNPs density. (x-axis) mtDNA position; (y-axis) SNPs density measured as variants per position (log scale).


