
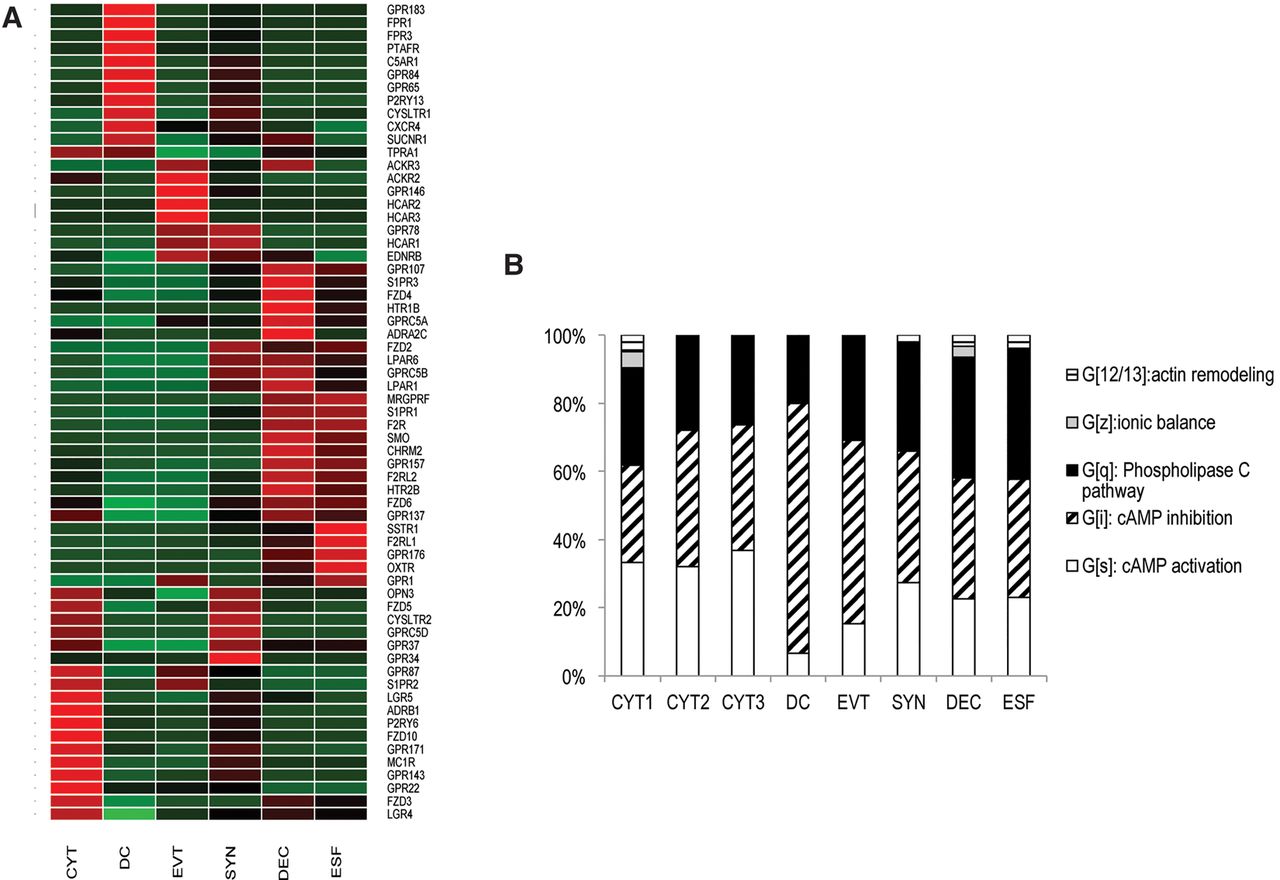
Figure 4.
Distribution of G-protein-coupled receptors among cell types. (A) The expression heat map of GPCRs across sampled cells. (B) Characterization of cell clusters by class of G-protein alpha subunit used.
(Downloading may take up to 30 seconds. If the slide opens in your browser, select File -> Save As to save it.)
Click on image to view larger version.
Distribution of G-protein-coupled receptors among cell types. (A) The expression heat map of GPCRs across sampled cells. (B) Characterization of cell clusters by class of G-protein alpha subunit used.
 CiteULike
 Delicious
 Digg
Digg Facebook
 Google+
 Reddit
 Twitter
