
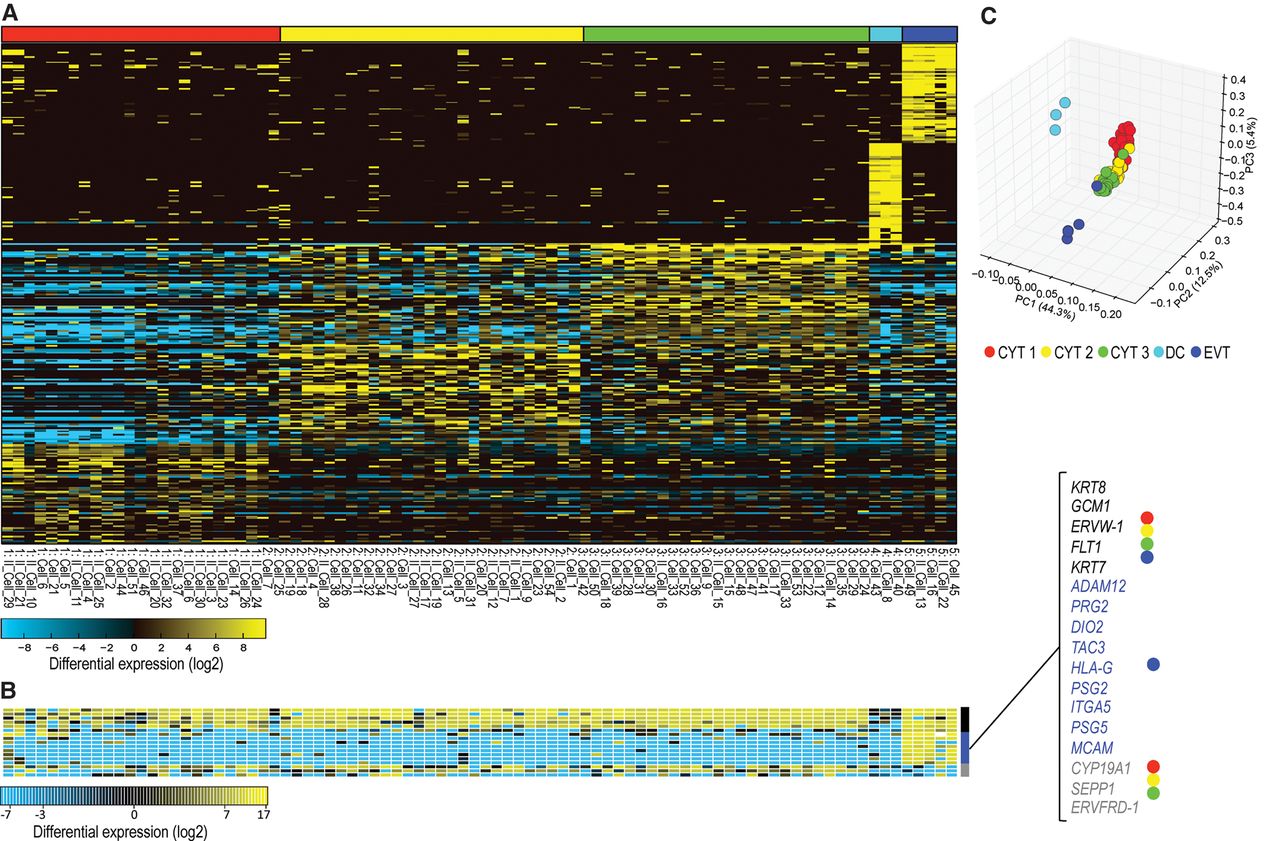
The gene expression in the single-cell experiment. (A) Expression of the top 300 genes with greater than twofold differential expression between clusters that were previously established by hierarchical clustering. x-axis: The cells with roman II denote the second batch of cells. Note that the cells from both batches are represented in all clusters. (B) Known trophoblast markers are shown separately, with general trophoblast markers in black, extravillous trophoblasts in blue, and cytotrophoblast-specific expression in gray. (C) First three principal components based on 300 marker genes (full PCA in Supplemental Fig. S8). Clusters correspond to the clustering in the heat map in A.


