
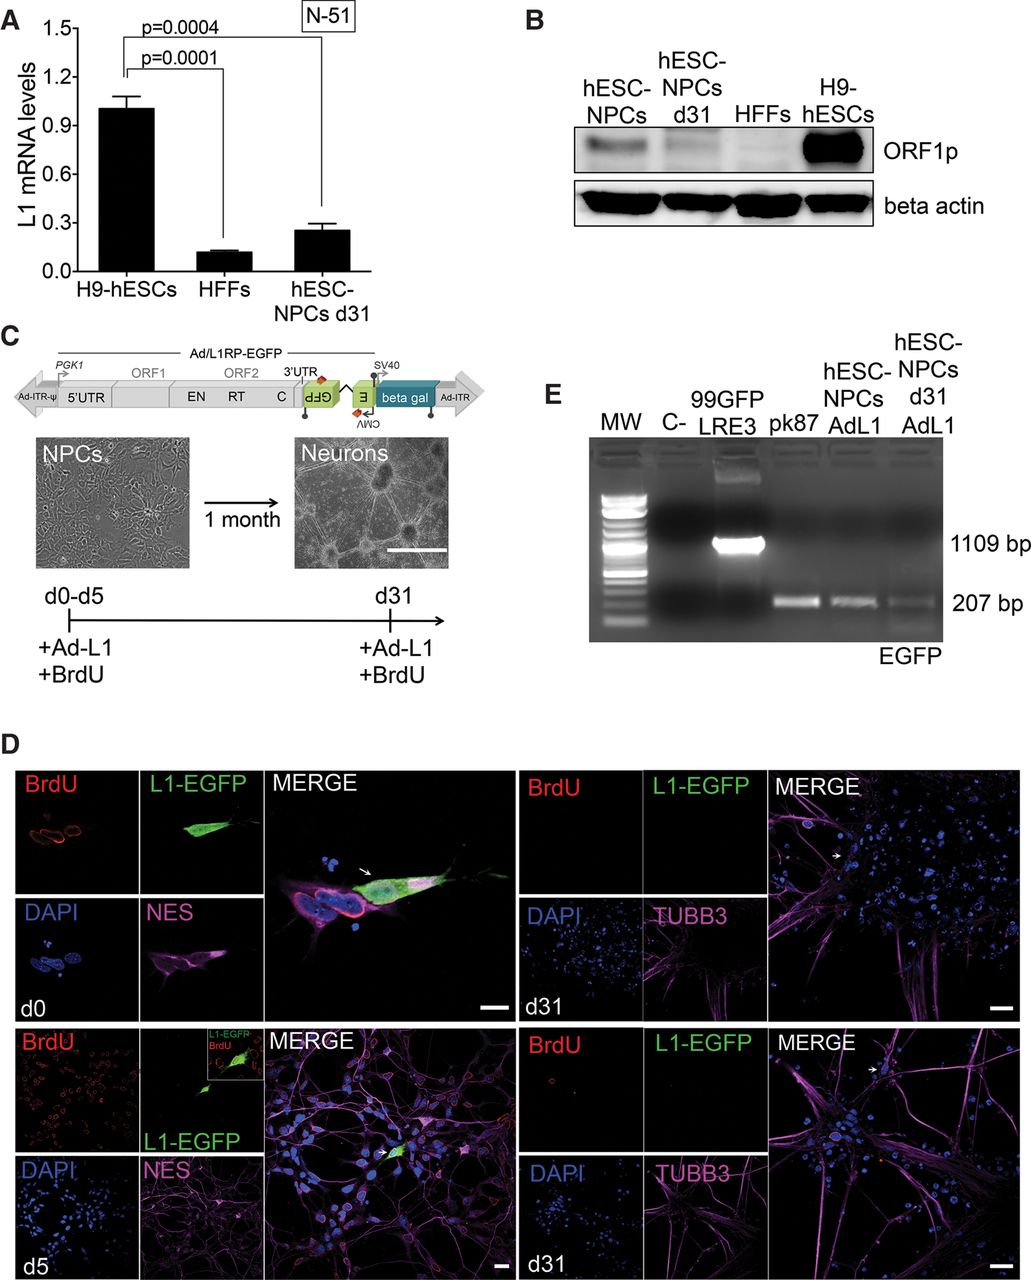
LINE-1 expression and retrotransposition in differentiating NPCs. (A) L1Hs mRNA expression analysis in differentiated NPCs (after 31 d of differentiation) as measured by RT-qPCR (n = 3 biological replicas). Also shown is the P-value (0.0004 and 0.0001, one-way ANOVA with Tukey) of the comparisons and the SEM. (B) Western-blot analyses of L1-ORF1p expression in the indicated cell type (above each lane). Beta actin was included as an internal control. (C) Rationale of the NPC differentiation Ad-L1 retrotransposition assay. A representative picture of NPCs and of mature neuronal cells is shown. At days 0, 5, 10, 15, 25, or 31, plated cells were infected with Ad-L1 in the presence of BrdU and analyzed 5–7 d later. (D) Representative results from retrotransposition assays conducted in differentiating NPCs using the Ad-L1. Each panel shows a merged image of Ad-L1 infected NPCs analyzed 5–7 d after infection and stained with an antibody against NES or TUBB3 (pink) and BrdU (red); nuclear DNA was stained with DAPI (blue) and L1-EGFP was stained with an EGFP polyclonal antibody (green). The small pictures at the left side contain the independent captured images used in the merged picture. (White bars) 10 µm in the d0 panel, and 20 µm in the d5 and d31 panels. Also indicated in each panel is the day when infection was performed (white letters on DAPI panels). (E) Results from the PCR-intron assay conducted on gDNAs isolated from Ad-L1 infected NPCs at the indicated time. In the PCR assay, gDNA isolated from pk87 cells (Garcia-Perez et al. 2010) and a vector containing the unspliced megfpI cassette (99-gfp-LRE3) were included as controls. (C- lane) PCR negative control without template.


