
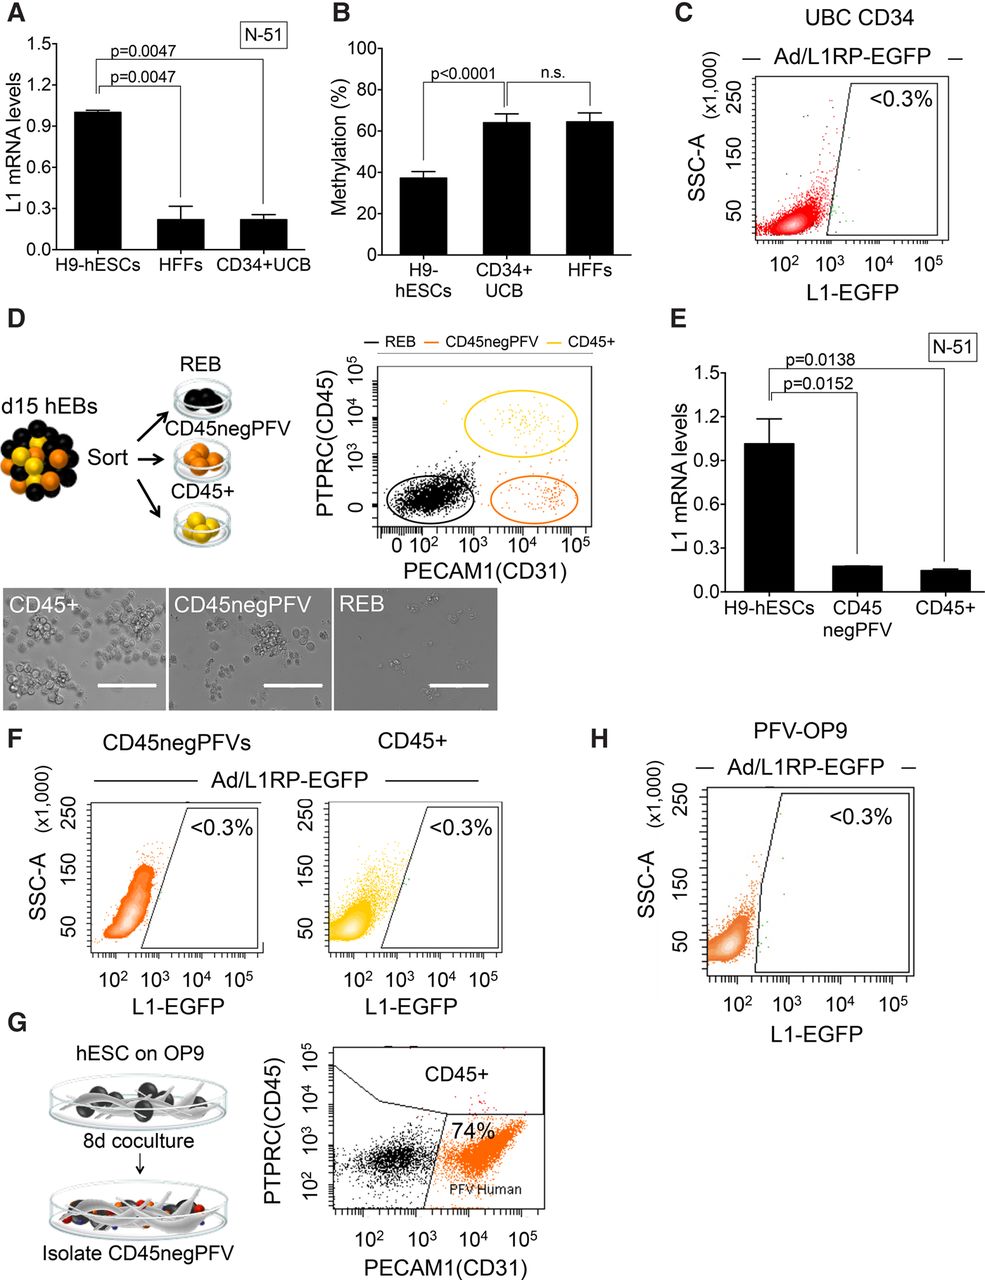
LINE-1 retrotransposition in hematopoietic stem cells. (A) L1Hs mRNA expression analysis in CD34+-HSCs cells isolated from UC blood as measured by RT-qPCR (n = 3 biological replicas). Also indicated is the P-value (0.0047, one-way ANOVA with Tukey) of the comparisons and the SEM. (B) L1Hs promoter methylation in CD34+-HSCs as measured by bisulfite-PCR assays. The graph shows the percentage of methylation detected in the indicated sample and the SEM. Also indicated is the P-value of the comparisons: P < 0.0001 or not significant (n.s.), one-way ANOVA with Tukey. (C) L1-retrotransposition in CD34-expressing HSCs using the Ad-L1 virus. Shown is a representative FACS histogram acquired 4 d post-infection. The percentage of EGFP-expressing cells is indicated within the histogram as determined in triplicate. (D) Scheme of the EB-based protocol to differentiate HSCs from hESCs. CD45+ and CD45negPFV populations are pictured using yellow and orange spheres, and black spheres are the remaining cells. (Right) FACS analysis of EBs after the differentiation protocol (PTPRC versus PECAM1). Representative images of the three identified populations are shown below. (REB) remaining cells; (white bars) 20 µm. (E) L1Hs mRNA expression analysis in CD45+ and CD45negPFV populations as measured by RT-qPCR (n = 2 biological replicas). The SEM and P-value of the comparisons (0.0138, 0.0152, one-way ANOVA with Tukey) are indicated. (F) L1-retrotransposition in CD45+ and CD45negPFV populations using Ad-L1. Shown are representative FACS histograms acquired 4 d post-infection: CD45+ (right); CD45negPFV (left). The percentage of EGFP-expressing cells is indicated within the histogram as determined in duplicate. (G) Scheme of the OP9-based protocol to differentiate HSCs from hESCs. (Right) Representative histogram (PTPRC versus PECAM1) 8 d after initiation of OP9 coculture. (H) L1-retrotransposition in the CD45negPFV population isolated using the OP9 method. Representative FACS histogram (SSC-A versus L1-EGFP) acquired 4 d post-infection. Also indicated is the percentage of EGFP-expressing cells as determined in triplicate.


