
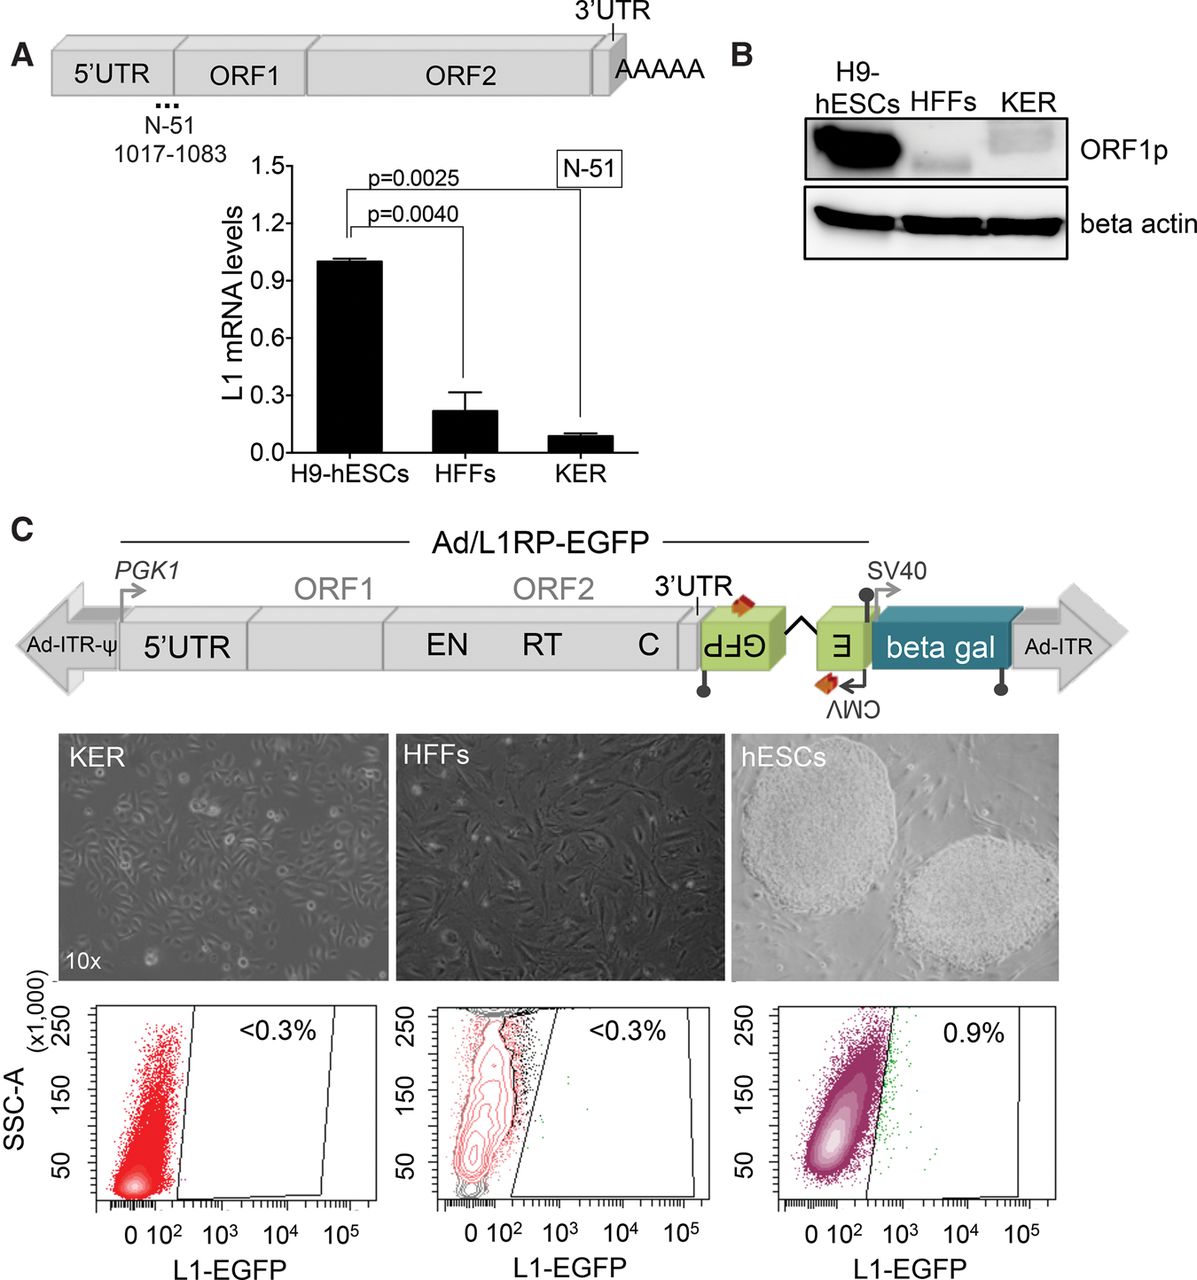
LINE-1 retrotransposition in human KERs and foreskin fibroblasts. (A) L1Hs mRNA expression analyses by RT-qPCR following the nomenclature and method described in Figure 1B. The graph shows expression data in the indicated sample and SEM (n = 2 biological replicas; one-way ANOVA with Tukey was used, P-value 0.0025 and 0.0040). (B) Western-blot analyses of L1-ORF1p expression in the indicated cell type (above each lane). Beta actin was used as a loading control. (C) Representative retrotransposition data using the Ad-L1 vector in the indicated cell type (7 d post infection). Below the cartoon of Ad-L1, bright field images of each cell type and representative FACS histograms are shown (the percentage of EGFP-expressing cells is indicated, triplicate). Only H9-hESCs accommodated detectable levels of Ad-L1 retrotransposition.


