
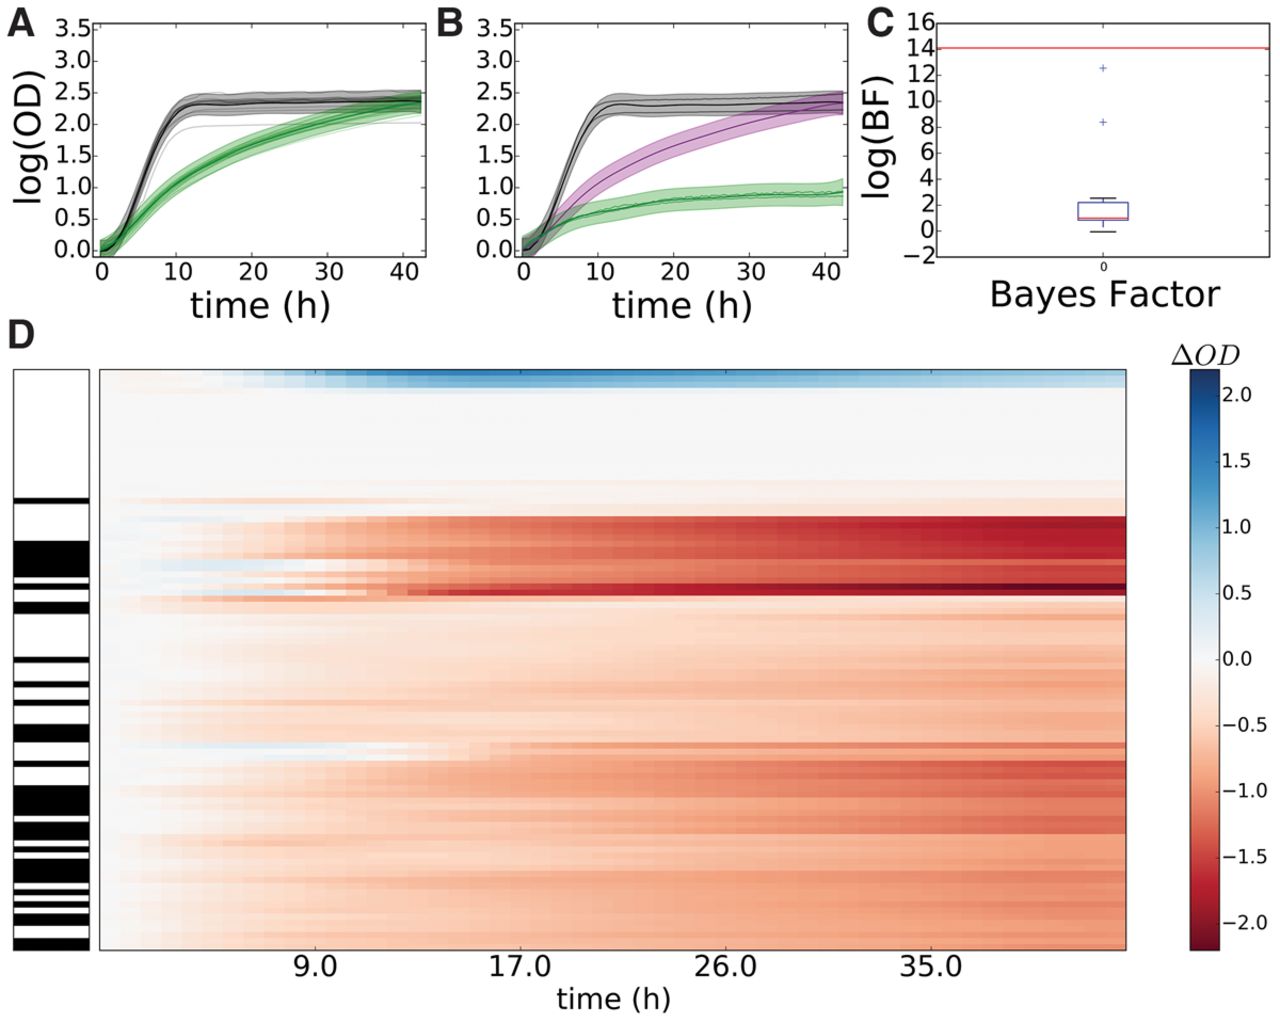
B-GREAT identifies significant growth phenotypes in yeast strains in response to paraquat. (A,B) Control strain BY4741 (A) and Saccharomyces paradoxus strain G4650 (B) growth under standard conditions (black) and under paraquat stress (green). Solid lines represent experimental data, and shaded regions represent B-GREAT model predictions. Purple-shaded region represents 95% credible region of B-GREAT prediction of G4650 in the absence of stress interaction (strain × stress = 0). (C) log(BF) (red line) and permuted log(BF)s (boxplot) of G4650 under paraquat stress according to B-GREAT. (D) ODΔ scores of all yeast strains under paraquat exposure. Left column corresponds to S. cerevisiae (white) or S. paradoxus (black) strains. Center column represents magnitude of calculated ODΔ over time for each strain.


