
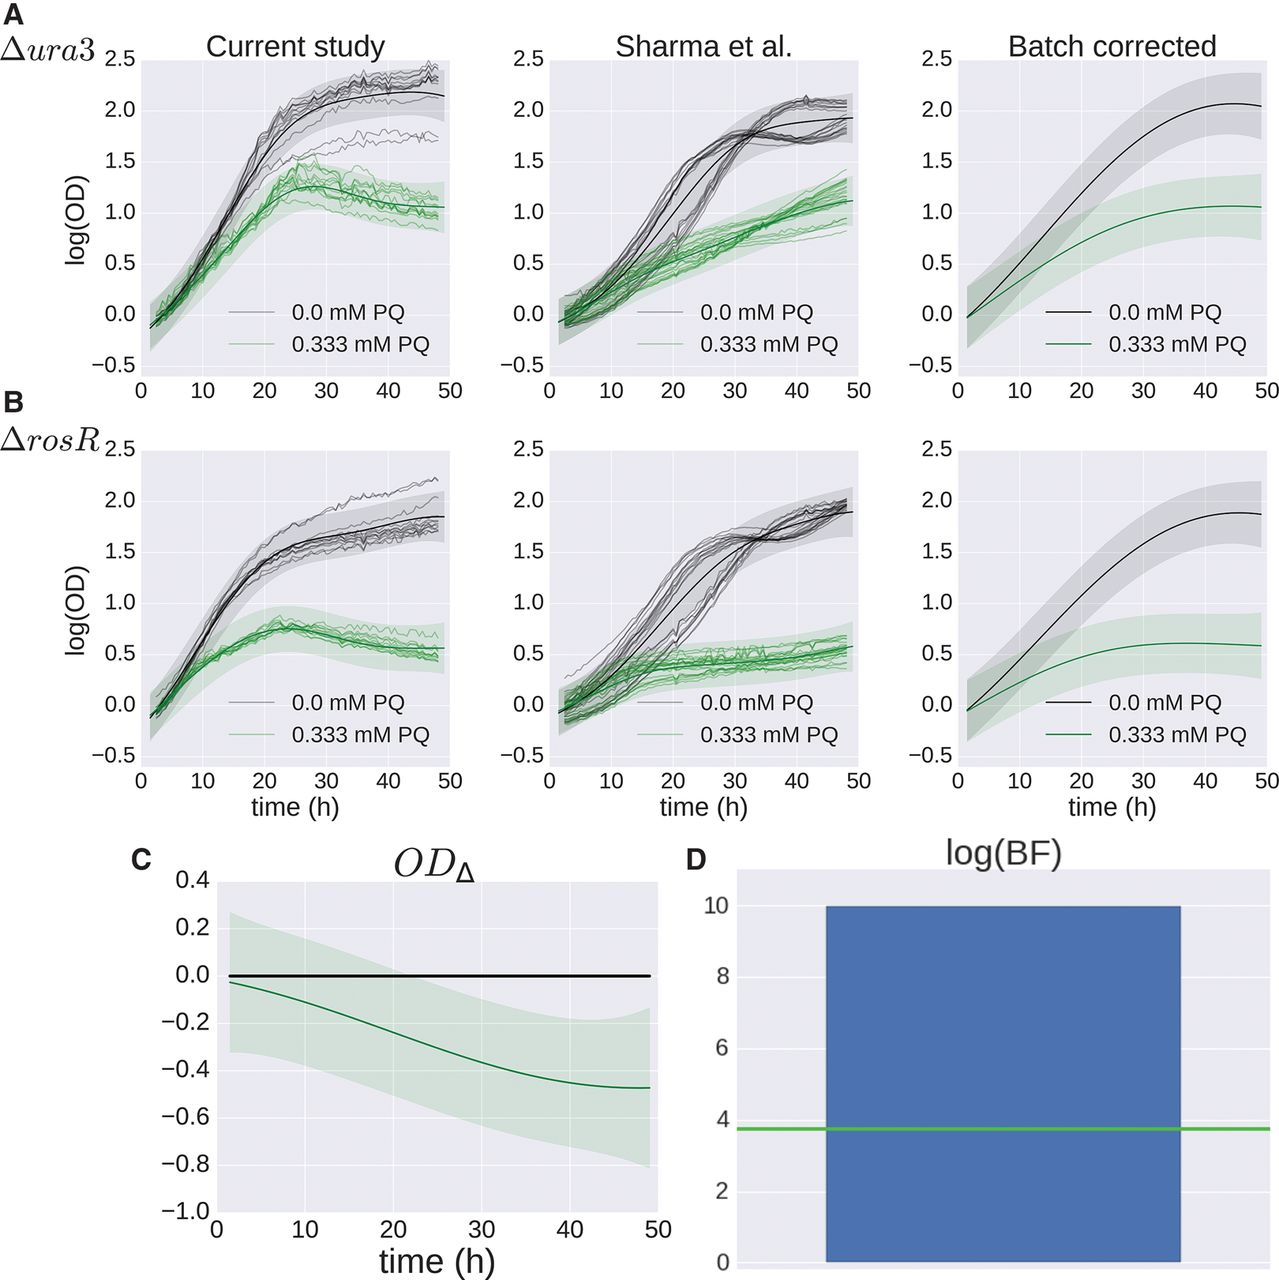
B-GREAT model of ΔrosR growth in response to oxidative stress across multiple studies. (A,B) Δura3 (A) and ΔrosR (B) growth data under standard conditions (black) and oxidative stress (green). Individual samples from this study (left) and previously published data (center) (Sharma et al. 2012) are shown as shaded lines. The B-GREAT model prediction for each condition is shown as solid line and shaded region for mean and 95% credible region, respectively. The growth prediction for the underlying growth function estimated across studies is shown in the right column. (C) The difference between ΔrosR and Δura3 growth for the underlying growth function corrected for batch effects, which shows an increased susceptibility of ΔrosR to oxidative stress relative to the parent strain. (D) log(BF) compared with permuted scores from the null distribution. Blue bar and green line represent observed BF and FDR ≤ 20% threshold, respectively.


