
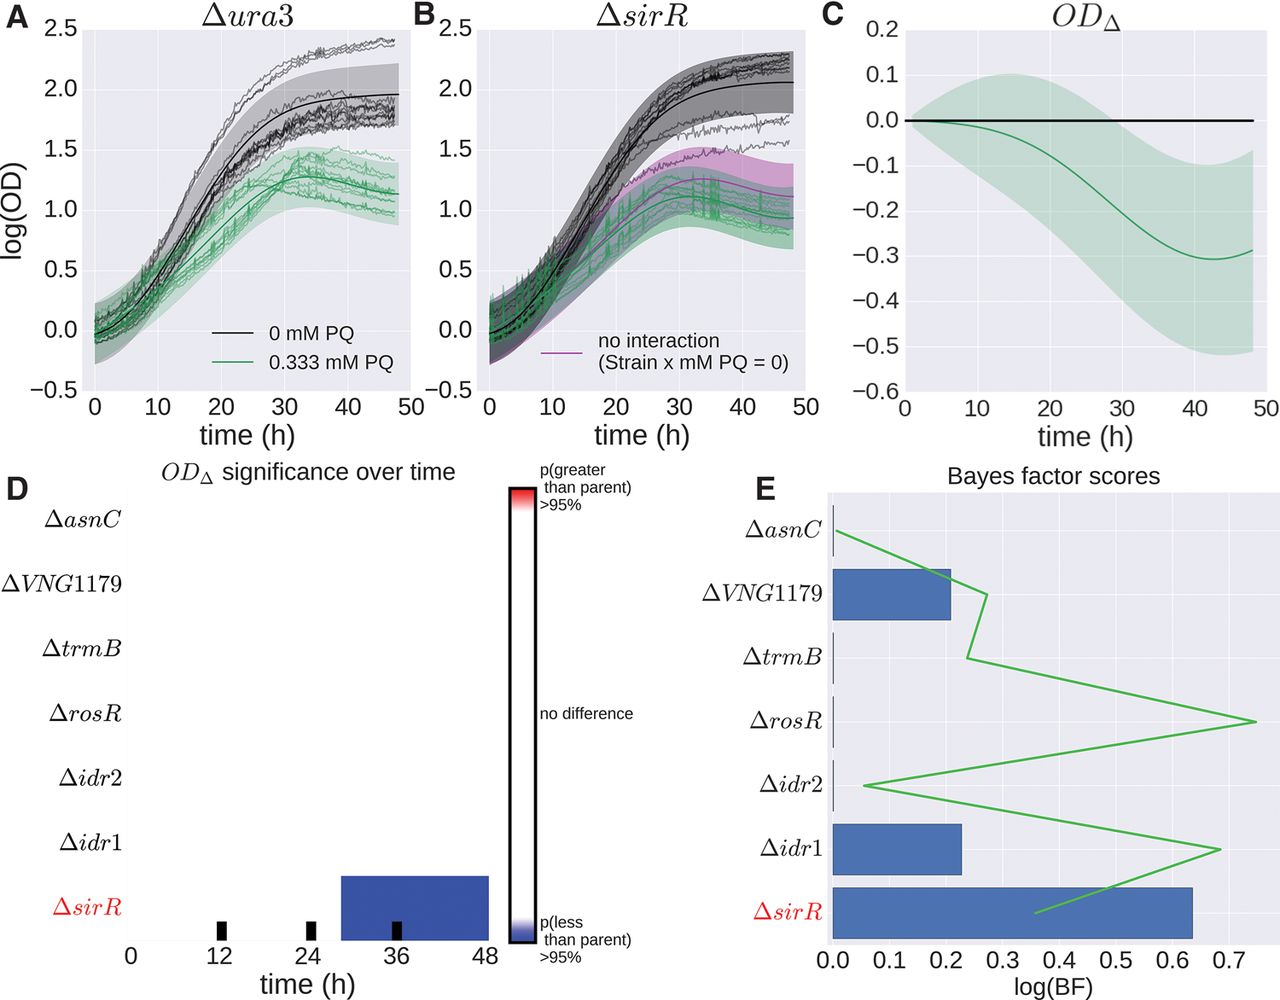
H. salinarum mutants with significant growth phenotypes under oxidative stress. (A,B) Example of population growth data from H. salinarum for mutant strain Δura3 (A) and ΔsirR (B) under standard conditions (black) and chronic oxidative stress (green). Each curve represents a different sample of an experimental condition. Gaussian process predictions for these conditions are shown as a solid line (mean) and shaded region (variance). The purple line represents the growth prediction when the Strain × mM PQ interaction term is zero. (C) Difference computed between the mutant growth level with interaction term (Strain × mM PQ = 1) and mutant growth without interaction (Strain × mM PQ = 0); solid lines represent mean, and shaded regions indicate 95% credible regions. (D) Functional difference and permuted BF scores for mutant strains in response to oxidative stress. Functional difference is computed between mutant strain with and without an interaction term between mutant and stress condition. (E) BF score and permuted BFs for each strain are shown, where blue bars and green line represent observed BF and FDR ≤ 20% threshold, respectively. Strains with FDR ≤ 20% are in red italics.


