
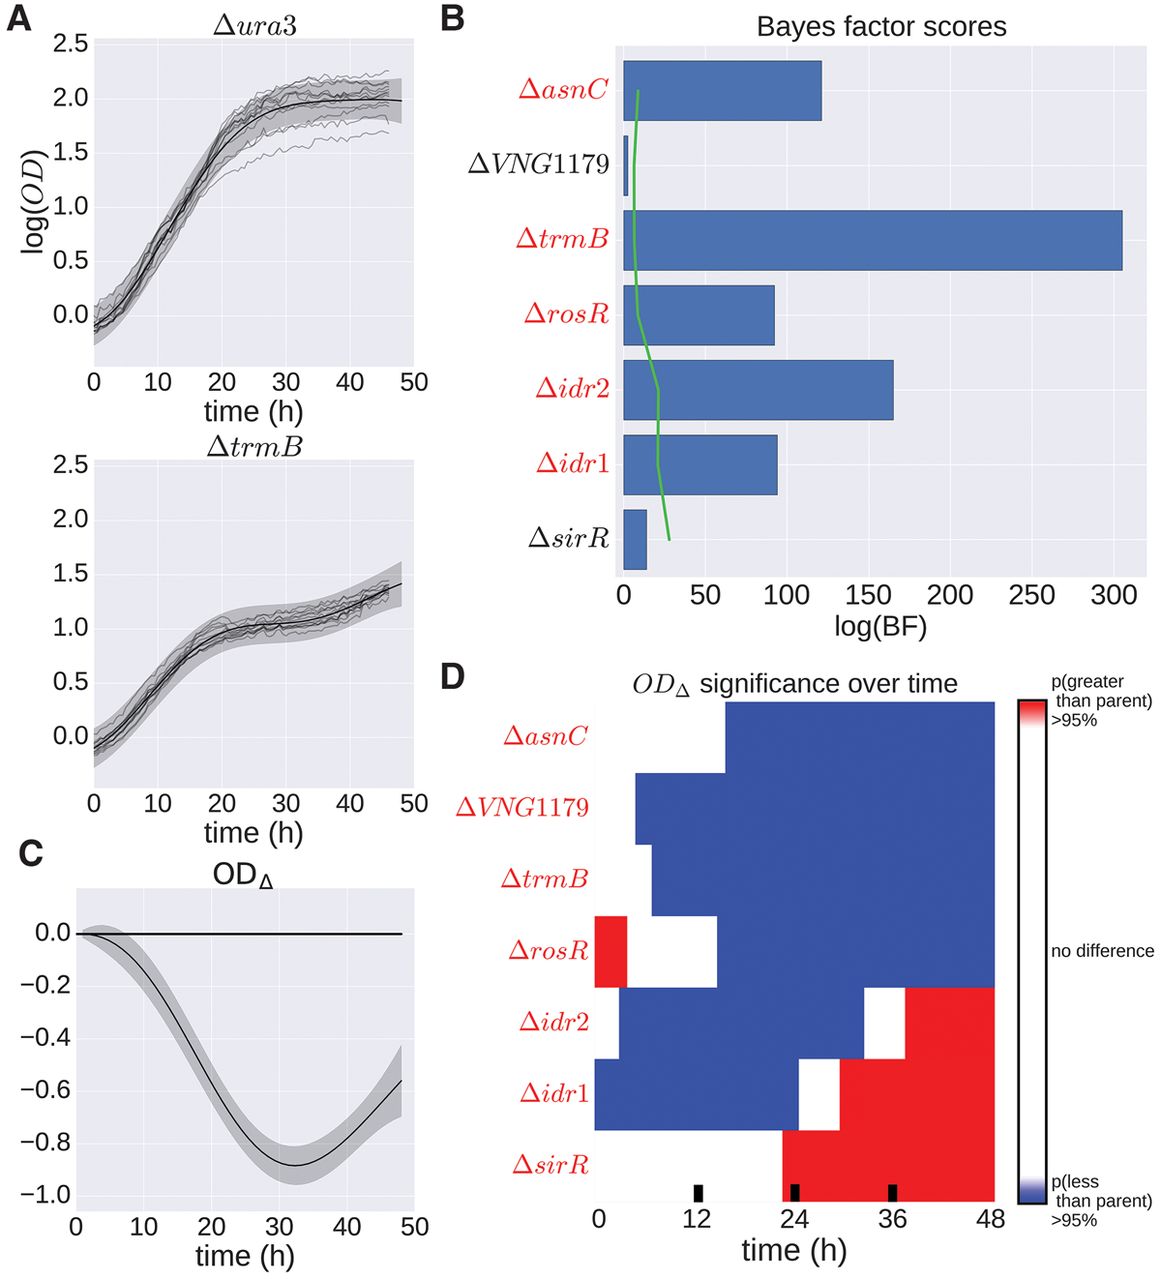
H. salinarum mutants with significant growth phenotypes under standard conditions. (A) Population growth data and GP model fit of H. salinarum parent strain Δura3 (top) and ΔtrmB (bottom) under standard growth. Light gray curves represent growth samples of each strain in different wells. Solid black lines and shaded gray regions indicate mean and 95% credible region of the GP model fit to the growth data, respectively. A single GP model was fit (equation 16) and separate growth predictions made for Δura3 and ΔtrmB (see Methods). (B) Bayes factors (BFs) for each mutant strain are shown as blue bars. Permuted BF scores representing an FDR ≤ 20% is indicated by the green line. Strains with a BF score with FDR ≤ 20% are in red italics. (C) The difference in growth level between ΔtrmB and Δura3 using the prediction of growth from the GP model. The solid line indicates mean difference, and the shaded region is the 95% credible region. Regions where the 95% credible region does not include zero suggest that the growth between the two strains is different at that time point with high probability. (D) Predicted difference between mutant and parent strain population growth using posterior function distributions as in the previous panel. Red and blue regions indicate a >95% probability that the mutant population growth is either higher or lower than the parent strain, respectively. Strains with ODΔ 95% credible region not including zero at any time point are in red italics.


