
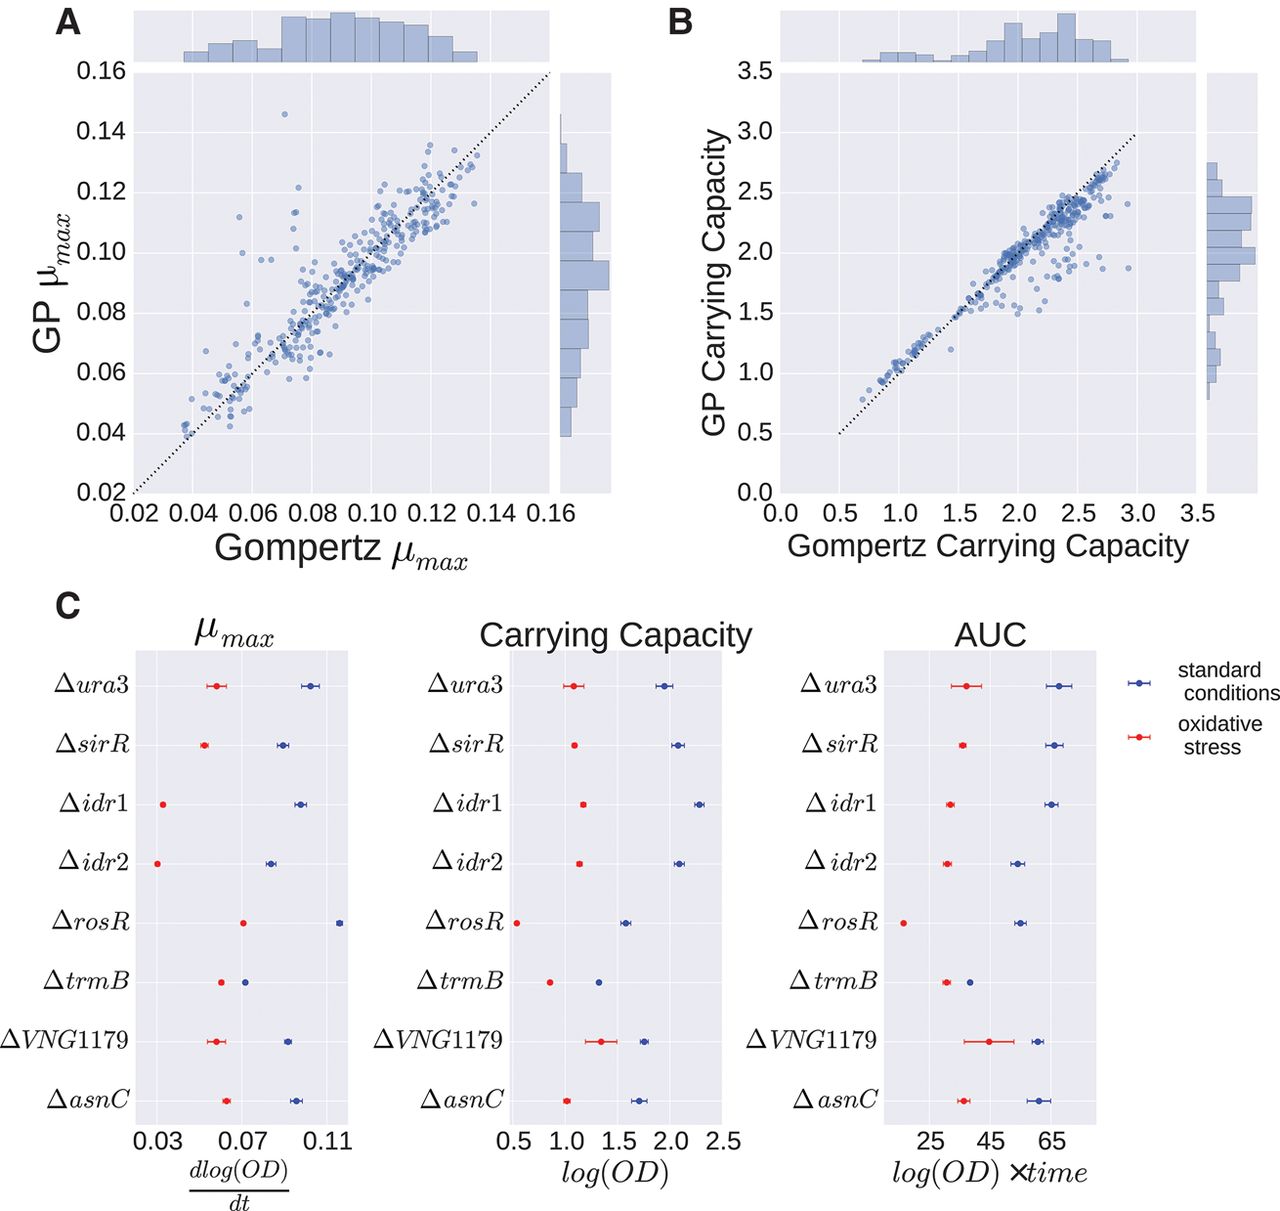
Figure 2.
Growth parameters estimated using GP regression. (A,B) Correlation of parameter estimates of μmax (A) and carrying capacity A (B) between Gompertz and GP regression. Dotted line represents the line y = x. (C) Posterior representations of growth parameters μmax, carrying capacity, and AUC are shown for each strain under standard conditions (blue) and oxidative stress (red). Points represent posterior mean; error bars, 95% credible regions.


