
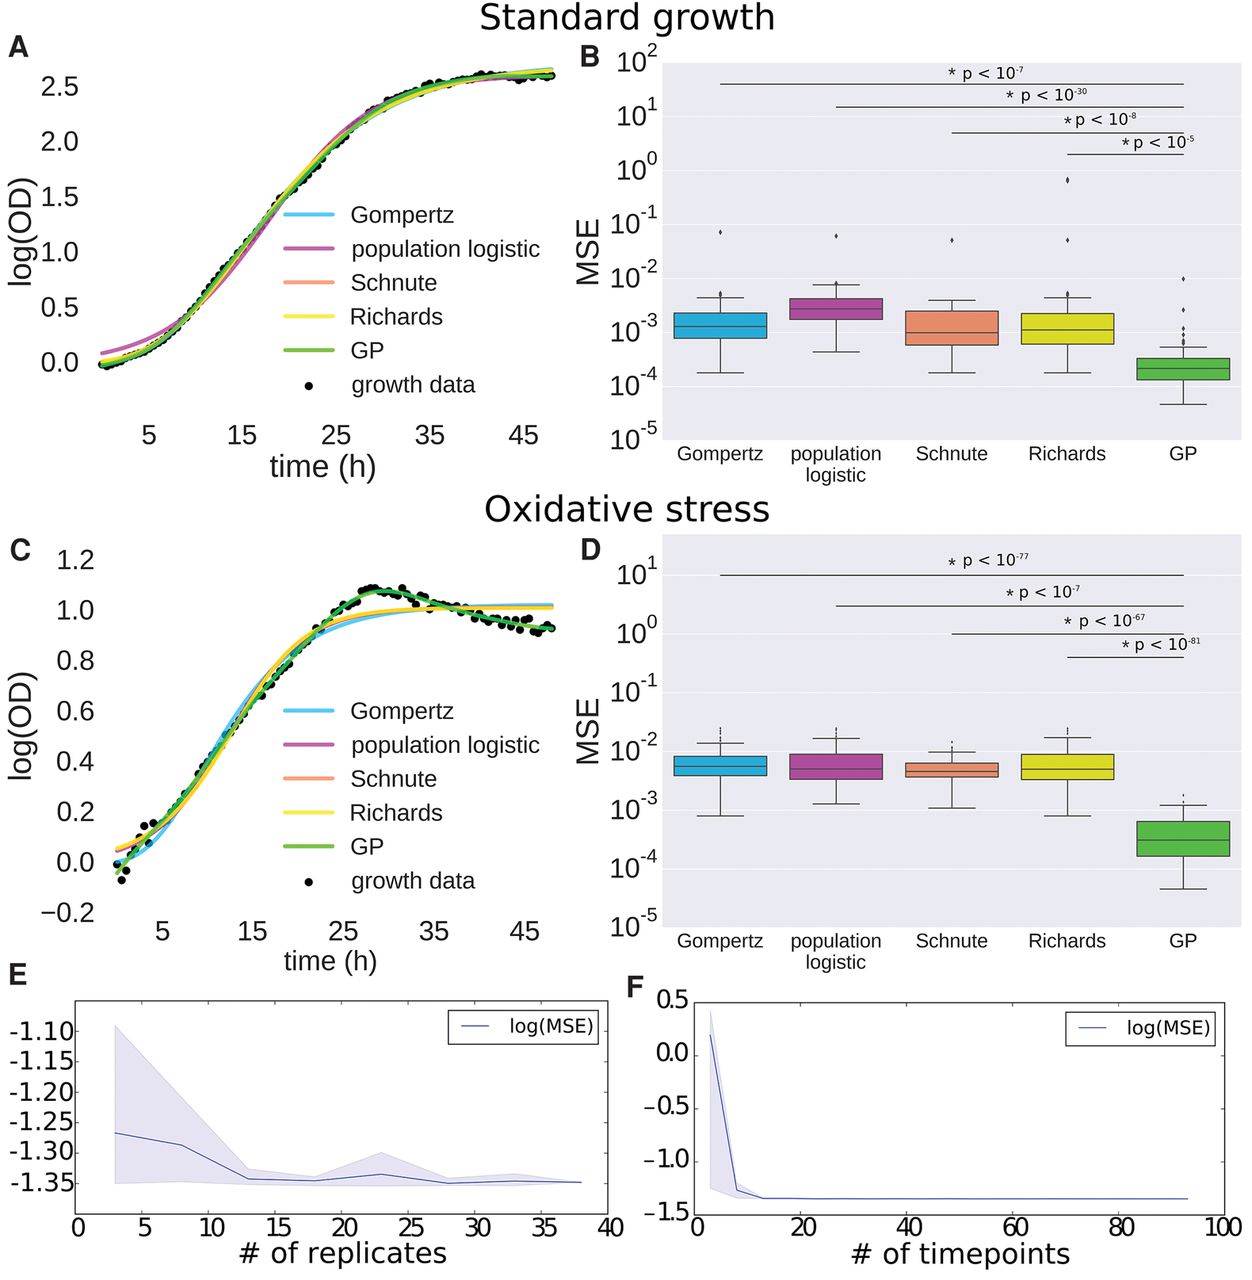
Gaussian process (GP) regression outperforms primary growth models. (A) Comparison of GP regression and primary growth models (Gompertz, population logistic, Schnute, and Richards) on microbial growth data under standard conditions. (B) Logarithm of mean squared error (MSE) for primary growth models compared with GP regression on microbial population growth under standard conditions. Bars with an asterisk indicate a significant difference between GP MSE and primary growth model MSE as determined by a one-sided t-test. P-values of the significance are indicated above the bars. (C) Comparison of GP regression and primary growth models on microbial growth data under oxidative stress. (D) Logarithm of MSE for primary growth models compared with GP regression on microbial population growth under oxidative stress. Bars with asterisks as in B. (E,F) Measure of MSE as a function of the number of replicates (E) and of time points (F) for GP regression. Solid lines represent mean MSE, and shaded regions represent empirical 90% confidence regions calculated from three random samplings of data at each number of replicates or time points.


