
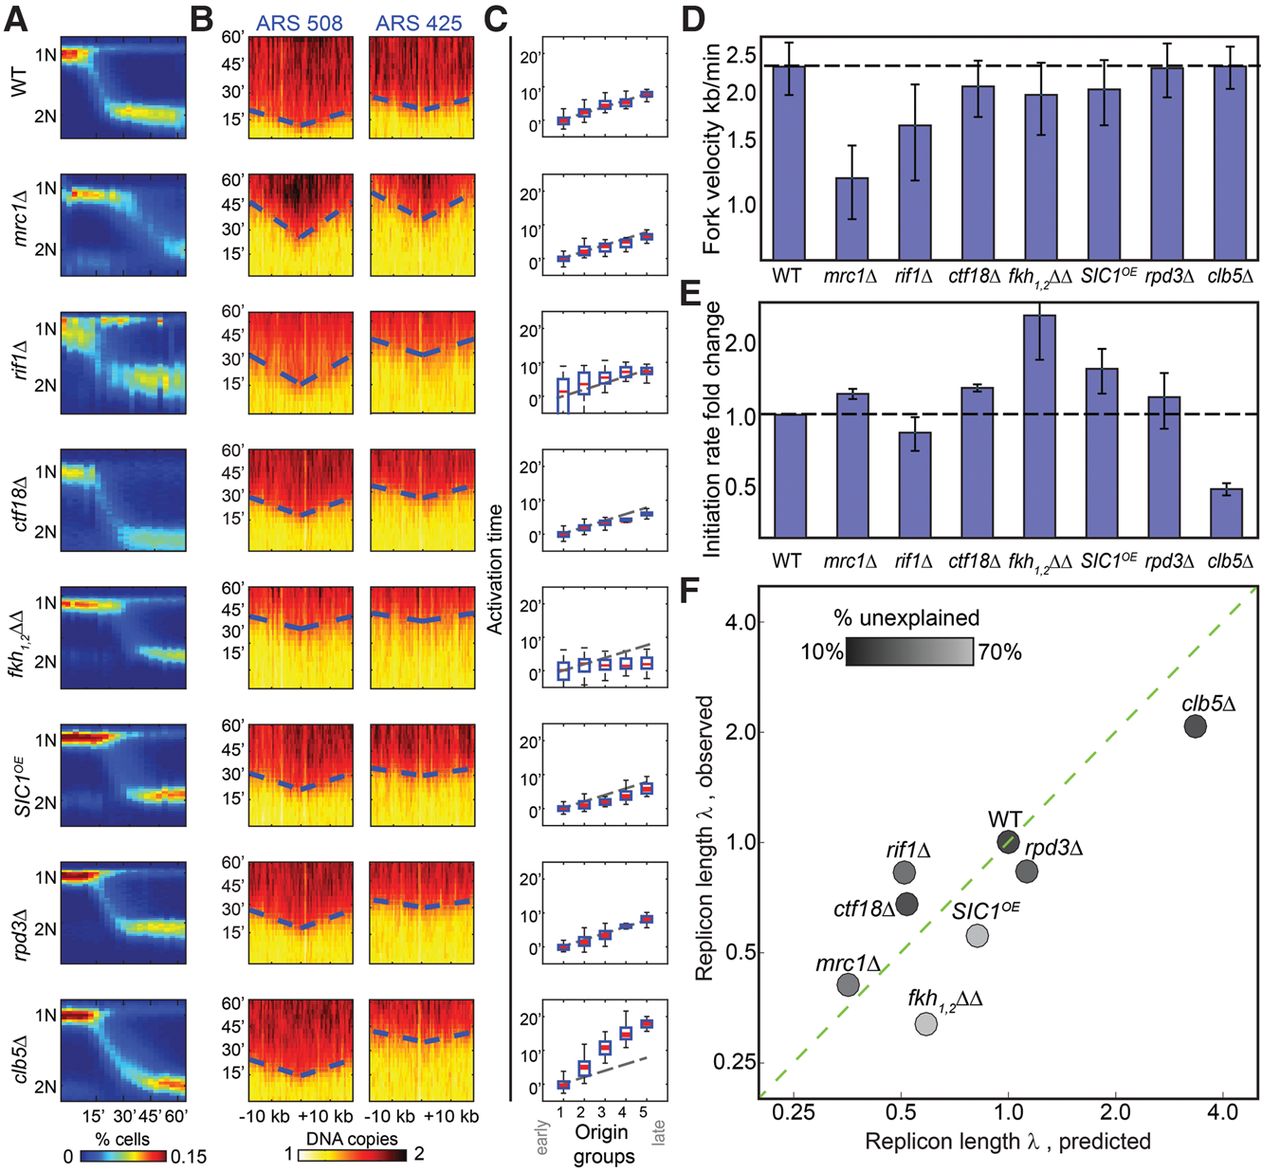
Temporal profiling validates predicted changes in fork velocity and initiation rates. (A) Synchronous progression through S phase. Cells were followed for 60 min following release from α-factor arrest and sampled at 3-min time resolution. Shown in color-code are the distributions of total DNA content (y-axis, measured using flow-cytometer) at different times (x-axis) for the indicated mutants. (B) Defining fork velocity from the temporal progression of replication around replication origins. Shown in color-code are DNA content around early (ARS508) and late (ARS425) origins (x-axis, measured using whole-genome sequencing) as a function of time (y-axis). Fork velocity is estimated by the slope, obtained by linear fit (dashed blue lines) of the estimated times at which different genomic regions around the origins replicated (trep, black). (C) Defining origin activation time from the gradual delay in origin activation time. Origins were classified into five groups based on their wild-type efficiency. Shown is the average activation time for origins in each cluster. Initiation capacity is inferred by the proportional delay in activation time between clusters (Supplemental Material). (D) Fork velocities of the indicated mutants. Velocities shown are an average over all origins. (E) Initiation capacities of the indicated mutants. Initiation capacity was inferred from the proportional delay in activation time between clusters, as shown in B (Supplemental Material). (F) Measured replicon lengths tightly correlated with the predicted values. Replicon lengths were calculated from the measured fork velocity v and initiation capacity l (λ = v/I) and are shown as a function of the replicon length predicted form the respective profiles of free-cycling cells. Both measures are normalized by the wild-type value. The shading-code indicates the extent to which the mutant profile is explained by the model assuming no origin-specific effects (residual score; black indicates high agreement) (Supplemental Material).


