
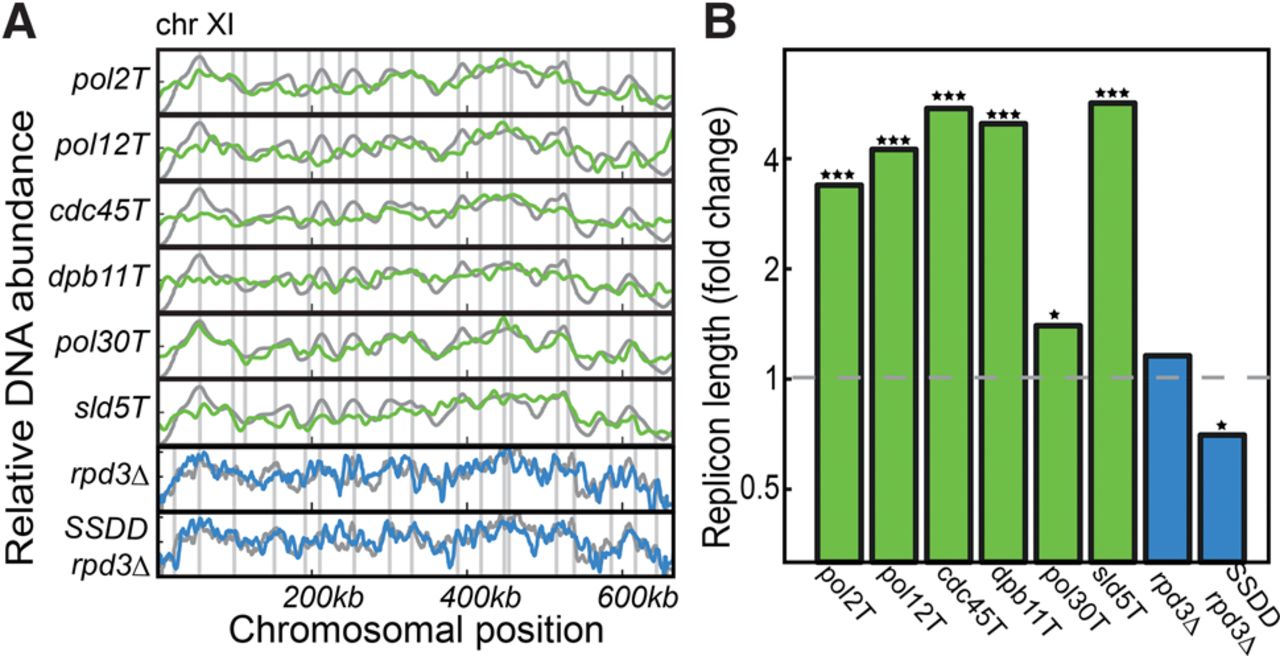
Replicon length is reduced when limiting abundance of initiation factors. Shown are the replication profiles (A, Chromosome XI) and the inferred replicon lengths (B), for the indicated genes expressed under the control of a TET-repressible promoter (green) and overexpression of the limiting factors SLD2, SLD3, DPB11, and DBF4 in the background of rpd3Δ ([Mantiero et al. 2011], denoted as SSDD rpd3Δ), with the rpd3Δ as control (blue). All experiments were done in duplicate, with the exception of rpd3Δ and SSDD rpd3Δ, which were done in triplicate, and the wild-type control, for which 13 independent replicates were performed. All changes in λ were significant, based on a one-sided two sample t-test between replicates (P-value = 0.01 for pol30Δ mutant, <10−10 for all other mutants showing higher λ, and 0.04 for the lower λ of SSDD rpd3Δ; the rpd3Δ control showed no significance at all). (*) P < 0.05, (***) P < 0.001.


