
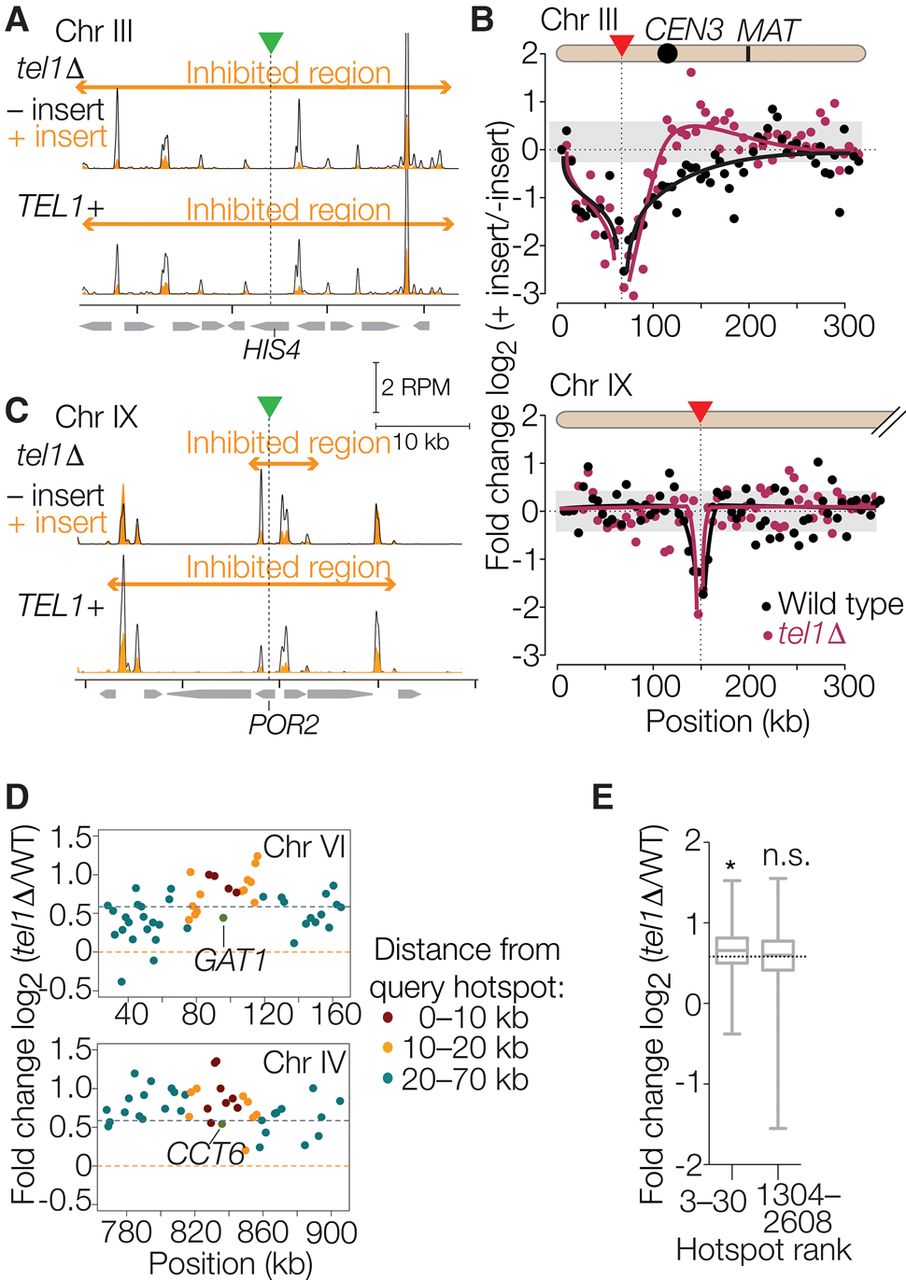
Communication between hotspots in cis along chromosomes. (A–C) Effect of artificial hotspot insertions. A hotspot construct containing arg4 and URA3 on a bacterial plasmid backbone (Wu and Lichten 1995) was inserted within the HIS4 gene on Chr III or the POR2 gene on Chr IX (green triangles and vertical dotted lines). (A,C) Spo11-oligo maps (smoothed with a 201-bp sliding Hann window) are shown for wild-type and tel1Δ strains with and without the insertion. (B) Each point shows, for each 5-kb segment moving outward from the insertion points, the log-fold change in the Spo11-oligo count caused by the presence of the artificial hotspot insertion (position of insertions denoted by red triangles). Curves were drawn manually to highlight the trends in the data. Gray shading encloses ± 1 SD for all 5-kb bins genome-wide (excepting Chr III and IX) to illustrate the range of sampling noise in this analysis. (D,E) Signature consistent with Tel1-dependent DSB interference around the strongest natural hotspots. In panel D, each point displays the log-fold change in Spo11-oligo count (4-h tel1Δ vs. wild type) for hotspots located the indicated distance away from either the GAT1 (top) or CCT6 (bottom) promoter hotspots. Horizontal dashed lines indicate genome-average change or no change. In panel E, boxplots summarize the log-fold change for hotspots located within 10 kb of the next 28 hottest hotspots (rank numbers 3–30) or within 10 kb of the middle third of hotspots (rank numbers 1304–2608). (*) P = 0.0011 for a one-sided Wilcoxon rank-sum comparison to all hotspots genome-wide, (n.s.) not significant (P = 0.61). Horizontal dotted line indicates genome-average change. Boxplots are as defined in Figure 4B.


