
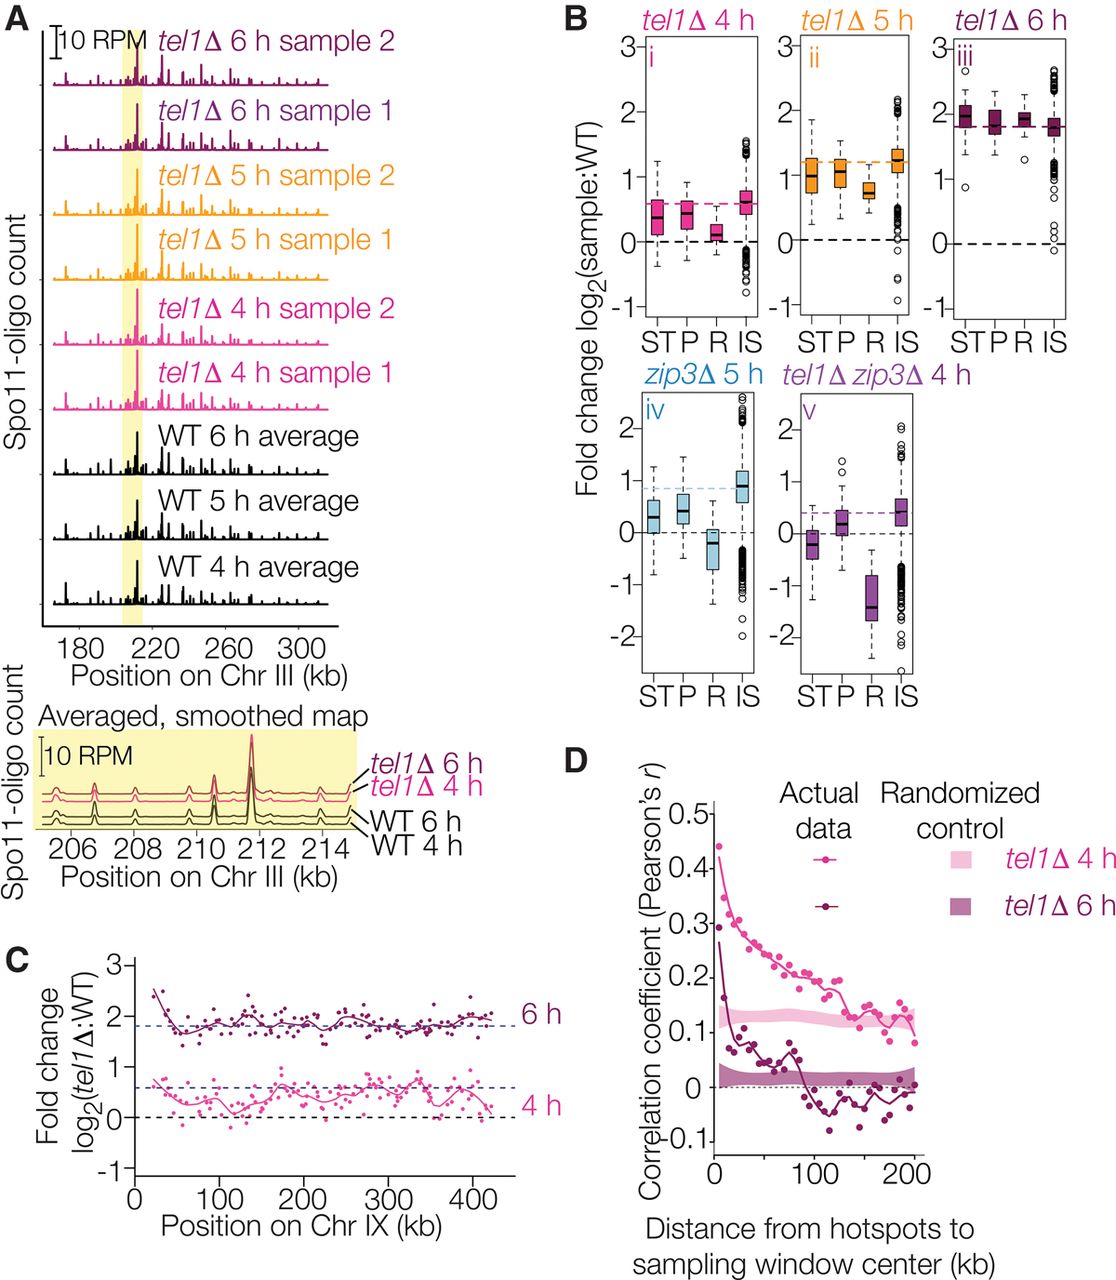
Spo11-oligo landscapes. (A) Reproducibility of Spo11-oligo maps. A representative segment from Chr III is shown at the top and a close-up view of averaged biological replicates in the yellow-highlighted region is shown below. Both Spo11-oligo maps were smoothed with a 201-bp Hann window. (B) Subchromosomal domains. Boxplots show the log-fold change in Spo11-oligo counts in each mutant relative to wild type for hotspots in the indicated genomic regions. (ST) Subtelomeric, 20 kb at each chromosome end (62 hotspots), (P) pericentric, 20 kb centered at each centromere (82 hotspots), (R) rDNA-proximal region (Chr XII: 451,577–467,570; 20 hotpots), (IS) interstitial, i.e., all other genomic regions. Thick horizontal lines are the medians, box edges are the 25th and 75th percentiles, whiskers indicate lowest and highest values within 1.5-fold of the interquartile range, and open circles are outliers. Colored dashed lines show the genome-average fold change for each mutant (1.5 for tel1Δ 4 h, 2.3 for tel1Δ 5 h, 3.5 for tel1Δ 6 h, 1.8 for zip3Δ 5 h, and 1.3 for tel1Δ zip3Δ 4 h). Black dashed lines at zero denote no change. Wild-type data for these and related comparisons are the averaged data for 4-, 5-, and 6-h samples. (C) Regional variation in the response of hotspots to the absence of Tel1. Chr IX is shown as an example. Each point is the log-fold change in Spo11-oligo count relative to wild type. Solid lines are local regression curves; dashed lines indicate genome-wide average fold change or no change. (D) Local domains of correlated behavior. Each point compares the log-fold change in hotspots with the change in their neighbors located in a 5-kb window the indicated distance away. Shaded regions show 95% confidence intervals for hotspots randomized within-chromosome; randomized data at 4 and 5 h show higher correlation because of the residual chromosome size effect (see Fig. 5A and Supplemental Fig. S3D). Subtelomeric, pericentric, and rDNA-proximal regions were excluded.


