
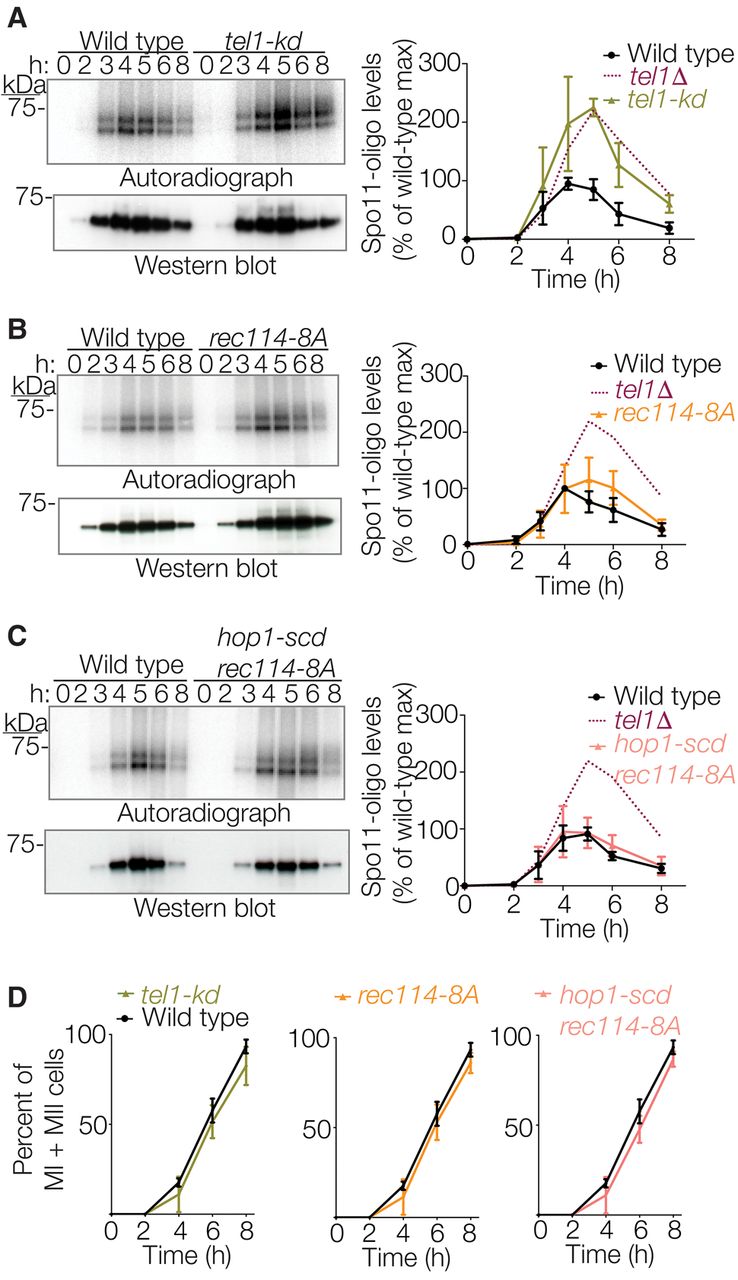
Figure 2.
Spo11-oligo complexes in tel1-kd, rec114-8A, and hop1-scd mutants. (A–D) Representative time courses and quantification of (A) two, (B) four, and (C) six independent mutant cultures processed in parallel with (A) three, (B) four, and (C) four independent wild-type cultures are shown as in Figure 1. To aid comparison, tel1Δ data are duplicated from Figure 1. (D) Meiotic division profiles for the same cultures.


