
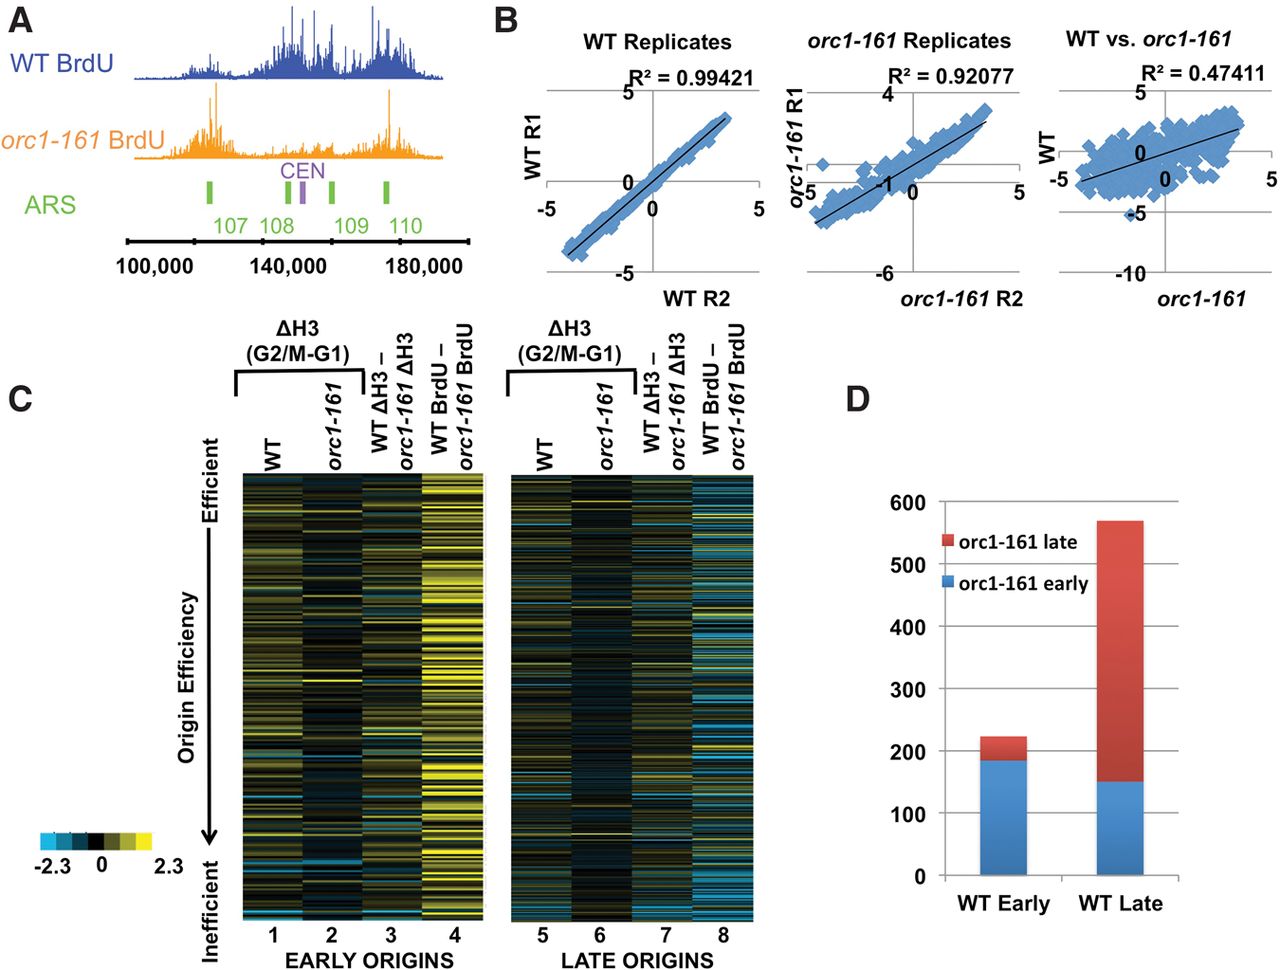
Reduction of nucleosome occupancy loss is accompanied with changes in origin usage profiles in orc1-161. (A) A snapshot of BrdU profiles for WT in blue and orc1-161 in orange. The region spans from 100,000 to 200,000 base pairs on Chromosome I. The green bars indicate annotated ARSs, and the purple bar indicates the centromere. (B) Graphs correlating averaged BrdU signals from all origins. Biological replicates of BrdU profiles from WT (left) and orc1-161 (center) were correlated. WT and orc1-161 profiles (right) were correlated with each other. (C) Heat maps showing the effects of the orc1-161 mutation on nucleosome occupancy and origin activity. Origins were separated by early and late firing, then ranked based on efficiency (OEM = −1 to 1) (McGuffee et al. 2013; Belsky et al. 2015). Each line represents an origin. Columns 1 and 5 show the changes in nucleosome occupancy between G2/M and G1 in wild-type cells. Columns 2 and 6 show the same in orc1-161 cells. Columns 3 and 7 show the differences in nucleosome occupancy changes between wild-type and orc1-161 cells (columns 1 subtracted by 2, and 5 subtracted by 6, respectively). Columns 4 and 8 show the differences in origin activity (BrdU signals) between wild-type and orc1-161 cells. (D) The effects of the orc1-161 mutation on origin firing time. BrdU profiling was performed in orc1-161 cells in the presence of 200 mM HU; origins that fired under this condition were designated as early firing origins, and those that do not fire were designated as late firing in the mutant. The left column shows the origins that fire early in wild-type cells, and the fraction of origins that are early and late firing in orc1-161 cells. The right column shows the origins that fire late in wild-type cells, and the fraction of origins that are early and late firing in orc1-161 cells.


