
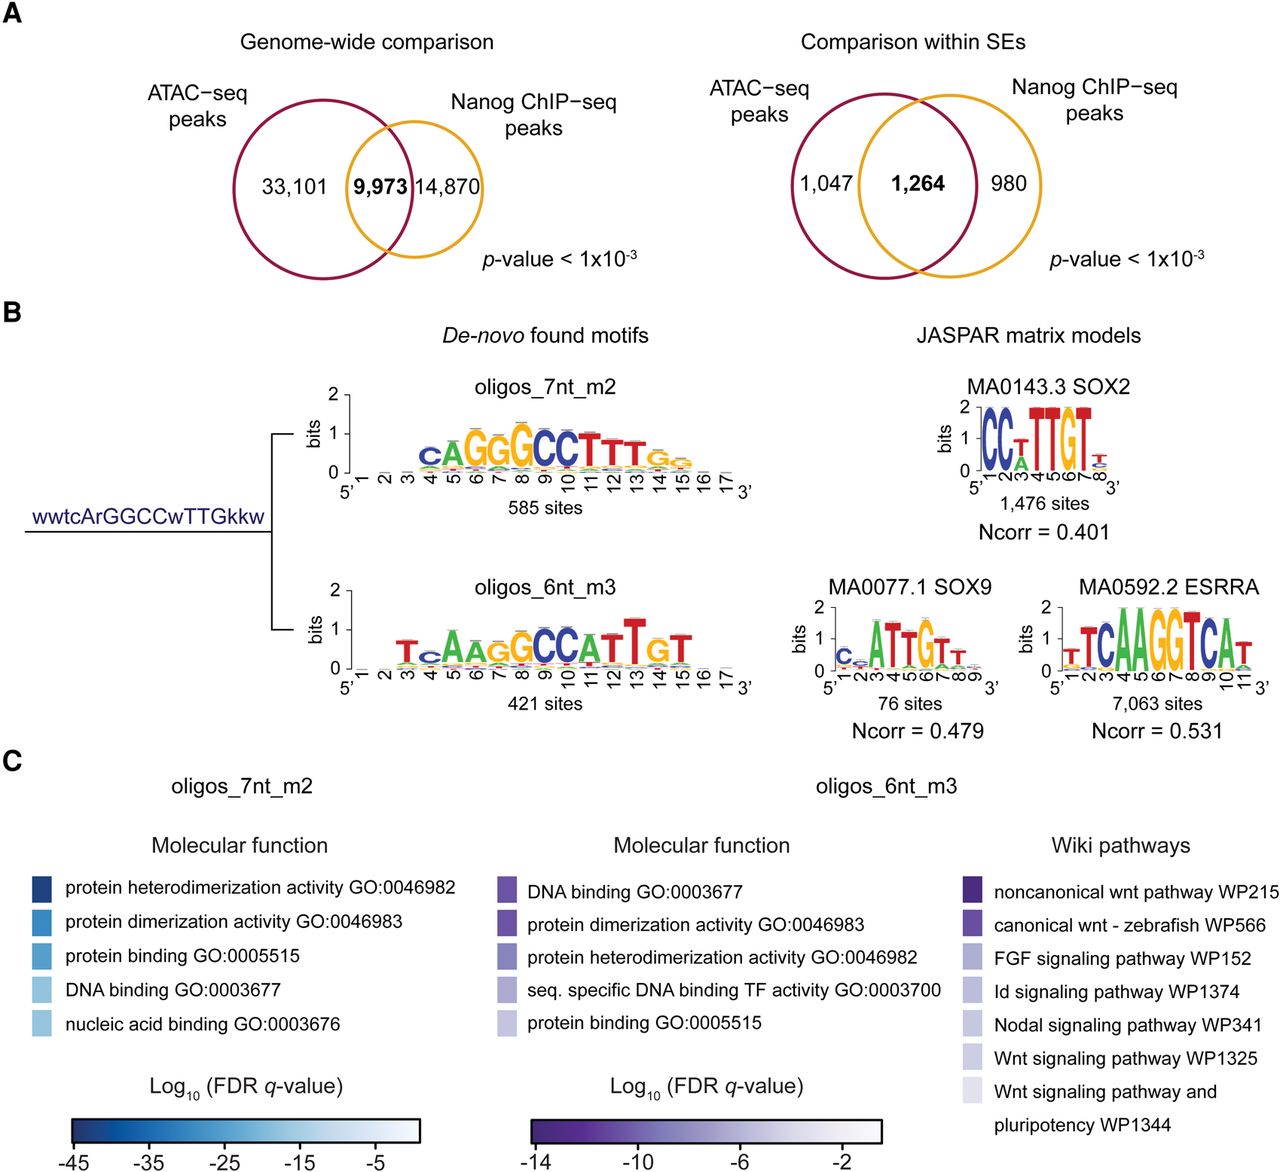
Analysis of zebrafish SE composition by ATAC-seq. (A) Venn diagrams representing the overlap between ATAC-seq peaks (purple) and Nanog peaks (orange) genome-wide (left) and within pluripotent state SEs (right). (B) Cluster, consensus motif sequence, and logos of SOX-related de novo–found motifs in ATAC-seq peaks within SEs (left). JASPAR matrix models (right) of SOX2, SOX9, and ESRRA. (Ncorr) Normalized correlation between identified motifs and JASPAR models. (C) Top molecular function and wiki pathway GO terms enriched for the ATAC-seq peaks containing sites of the de novo identified oligos_7nt_m2 (left) and oligos_6nt_m3 (right) motifs shown in B. Binomial FDR q-values for the GO terms are displayed in a color-scale (q-values ≤6.7 × 10⁻⁴).


