
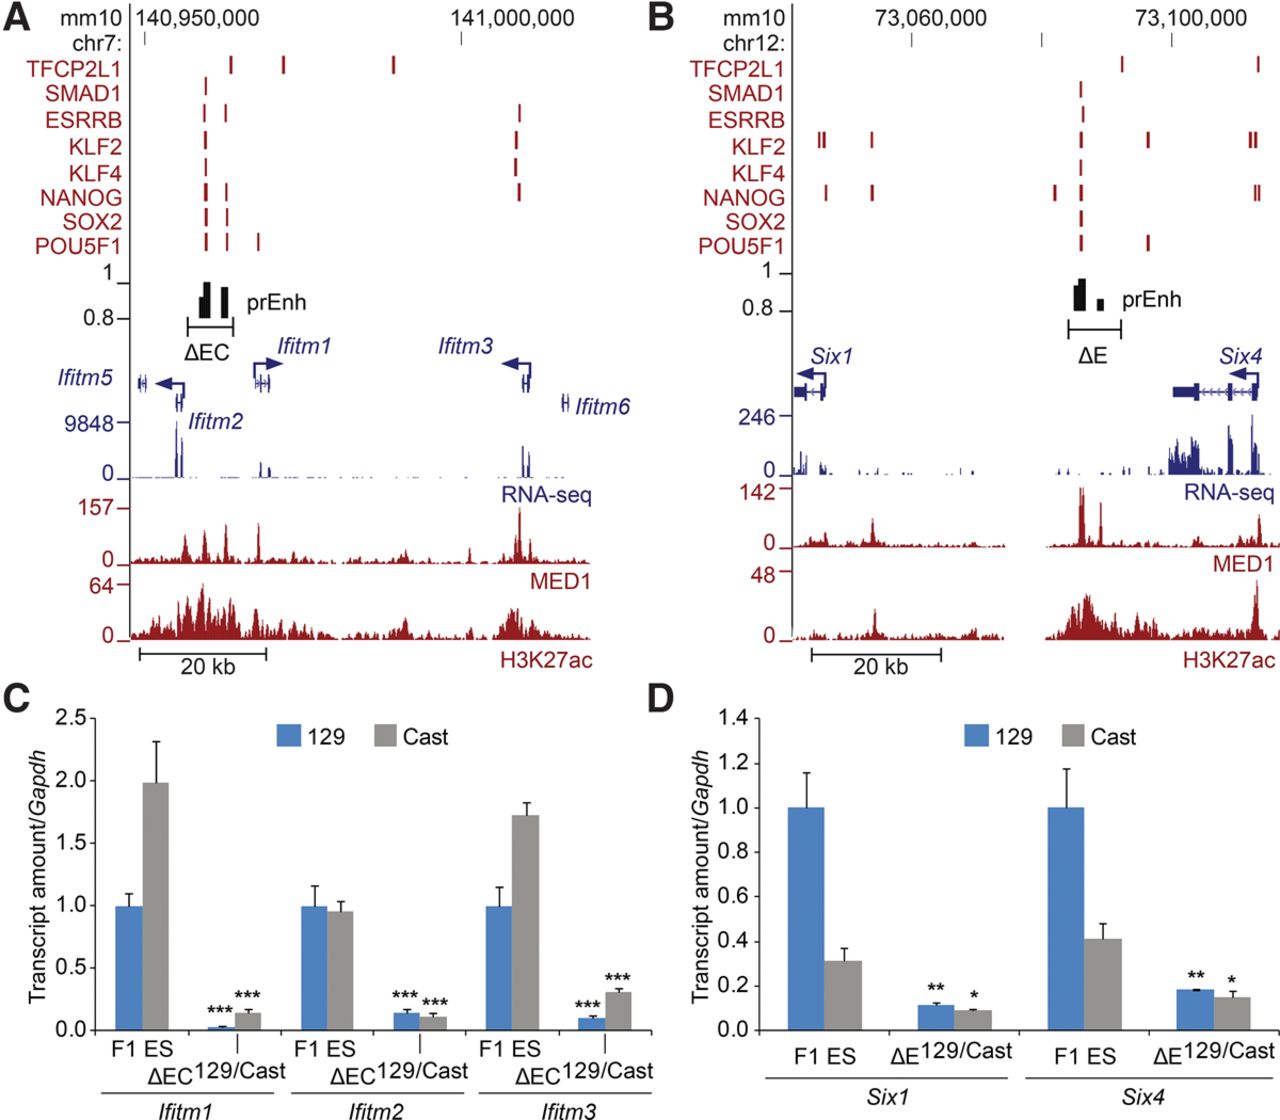
Coordinate control of paralogs in a gene cluster. (A,B) Schematic representation of the Ifitm and Six loci. Transcription factor-bound regions (red bars), MED1 and H3K27ac ChIP-seq and RNA-seq data obtained from the CODEX database are shown. Predicted enhancers (prEnh) are shown in black. The deleted regions (ΔEC and ΔE) are shown with a line that links the 5′ and 3′ gRNA targets. All data are displayed on the mm10 assembly of the UCSC Genome Browser. (C,D) Deletion of the Ifitm enhancer cluster (ΔEC) or the Six enhancer (ΔE) significantly affects transcription of the expressed genes in the cluster. Allele-specific primers detect 129 or Cast RNA in RT-qPCR from F1 ES and Δ129/Cast clones. Expression is shown relative to the F1 ES 129 value. Error bars represent SEM. Significant differences from the F1 ES values are indicated: (*) P < 0.05, (**) P < 0.01, (***) P < 0.001.


