
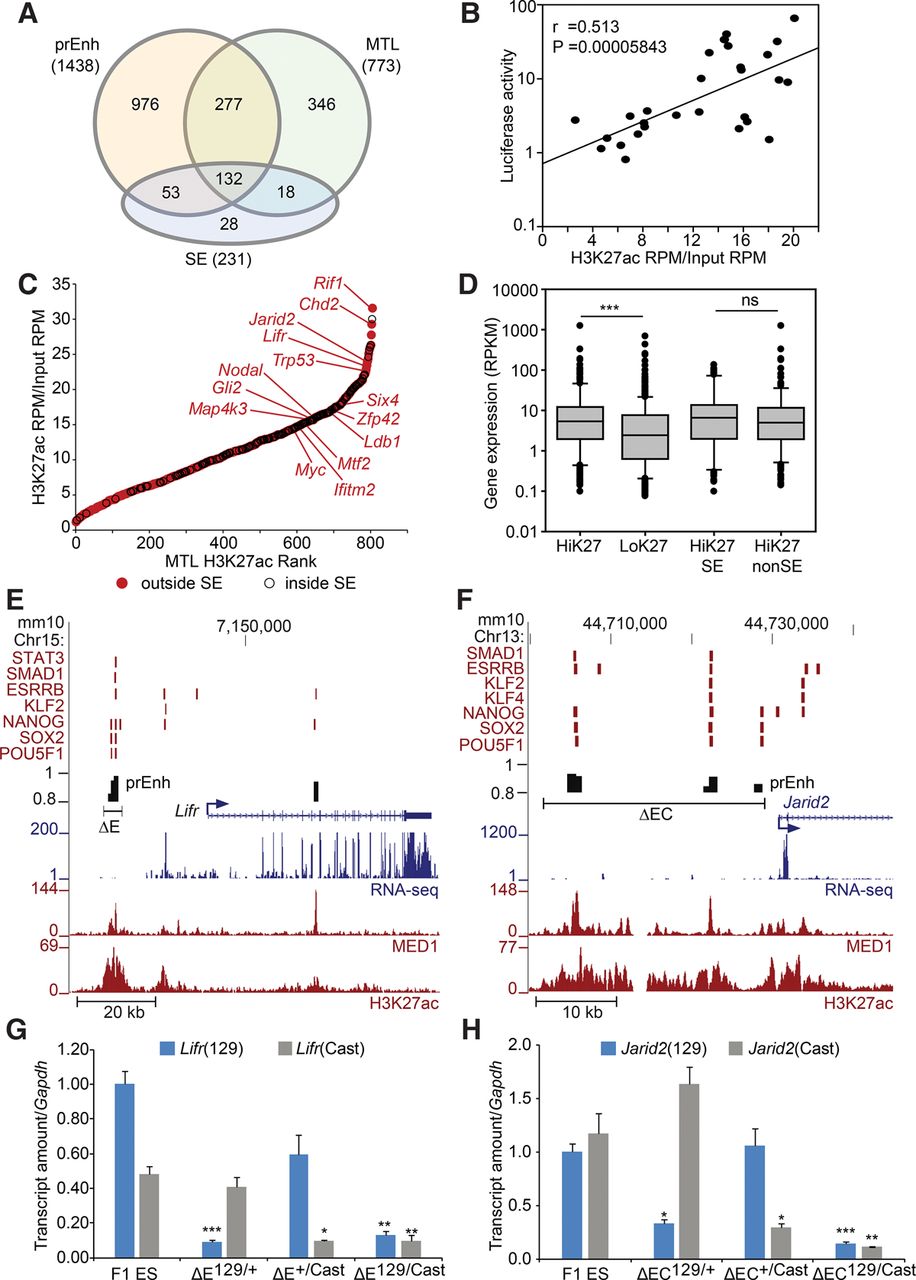
Robust enhancers separate from super-enhancers. (A) Venn diagram describing the overlap between predicted enhancers (prEnh), multiple transcription factor-bound loci (MTLs ≥ 5) and super-enhancers (SEs). (B) The significant correlation between enhancer activities in a luciferase reporter assay and the H3K27ac ChIP-seq signal at these enhancer regions. Pearson correlation coefficient (r) and significance level (P) are shown. (RPM) Reads per million. (C) MTLs outside and inside of super-enhancers were ranked according to the intensity of the H3K27ac signal within a region ±1 kb of the MTL midpoint. Genes predicted to be regulated by the indicated MTL regions located outside of super-enhancers (red) are shown. (D) MTLs with high H3K27ac (HiK27) are associated with significantly higher ([***] P < 0.001) expression of their target genes than MTLs with low H3K27ac (LoK27). There is no significant difference (ns) between the expression of associated genes for MTL with high H3K27ac found inside (HiK27SE) or outside of super-enhancer (HiK27nonSE) regions. (E,F) Schematic representation of the Lifr and Jarid2 loci. Transcription factor bound regions (red bars), MED1 and H3K27ac ChIP-seq and RNA-seq data obtained from the CODEX database are shown. Predicted enhancers (prEnh) are shown in black. The deleted regions (ΔE and ΔEC) are shown with a line that links the 5′ and 3′ gRNA targets. All data are displayed on the mm10 assembly of the UCSC Genome Browser. (G,H) Deletion of the Lifr enhancer (ΔE) or the Jarid2 enhancer cluster (ΔEC) significantly affects the expression of the linked allele. Allele-specific primers detect 129 or Cast RNA in RT-qPCR from F1 ES, Δ129/+, and Δ+/Cast and Δ129/Cast clones. Expression is shown relative to the F1 ES 129 value. Error bars represent SEM. Significant differences from the F1 ES values are indicated: (*) P < 0.05, (**) P < 0.01, (***) P < 0.001.


