
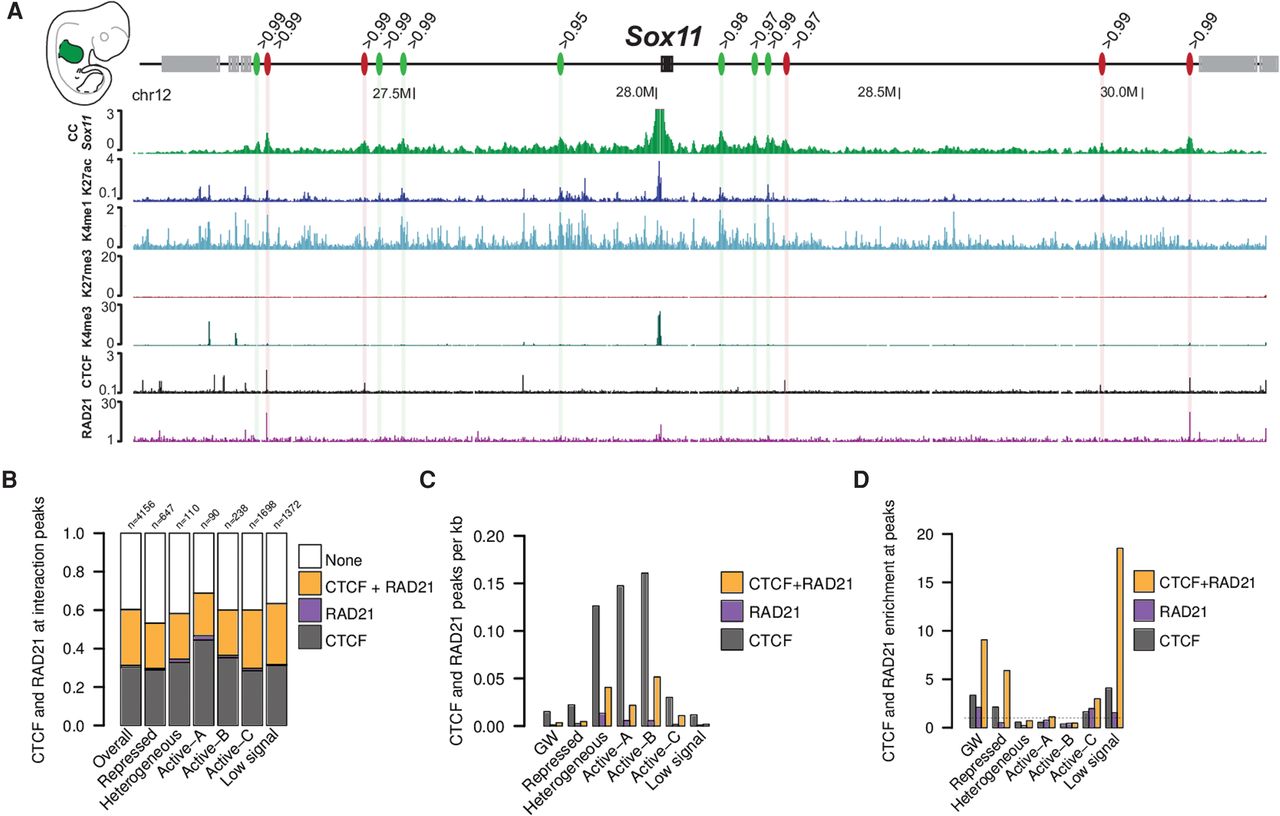
Association of interactions with CTCF and RAD21. (A) Several distal interactions are formed at the Sox11 locus in the forelimb at E11.5. As some appear to be linked to CTCF/RAD21 (red ovals), others do not form at CTCF/RAD21 binding sites (green ovals) but rather at H3K27ac regions. The number above each oval indicates the percentile of the interaction intensity. (B) Fraction of interactions in which a peak for CTCF, RAD21, or both was called. “Overall” refers to all identified interactions, independently of the associated chromatin state in which they occur. These data are derived from the combined analysis from all tissues and time points. “n” indicates the number of interactions found in every chromatin state independently. (C) Number of CTCF/RAD21 peaks per kilobase genome-wide and for each chromatin state independently. These data are aggregated from all tissues and time points. (D) Peaks for CTCF, RAD21, and cobound CTCF/RAD21 sites were counted at interaction peaks and divided by the size of the peak regions. To calculate enrichment, we divided this density by the genome-wide and state-specific density shown in C. These data are aggregated from all tissues and time points.


