
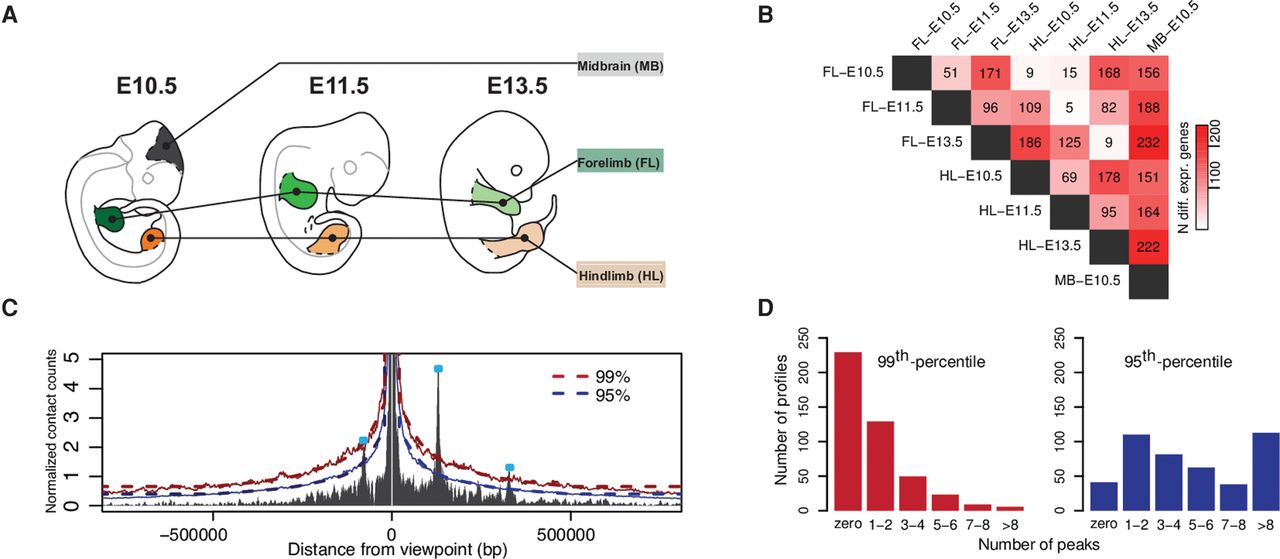
Experimental setup and calling of interaction peaks. (A) Seven tissues were selected to perform CC, RNA-seq, and ChIP-seq from: fore- (FL) and hindlimb (HL) at E10.5, E11.5, and E13.5, as well as midbrain (MB) at E10.5. (B) Number of differentially expressed genes from pairwise comparisons of RNA-seq data among the different tissues (threshold: abs[log2 fold change] > 1, adjusted P-value < 0.01). (C) Calling of interaction peaks using an empirical background model. The red and blue solid lines represent the 99th and 95th percentile, respectively. Dashed lines indicate smoothed threshold lines, values set fixed at 0.5 Mb from the viewpoint. (D) Number of peaks per viewpoint averaged over tissues and time points for two cutoff values: 99th and 95th percentile.


