
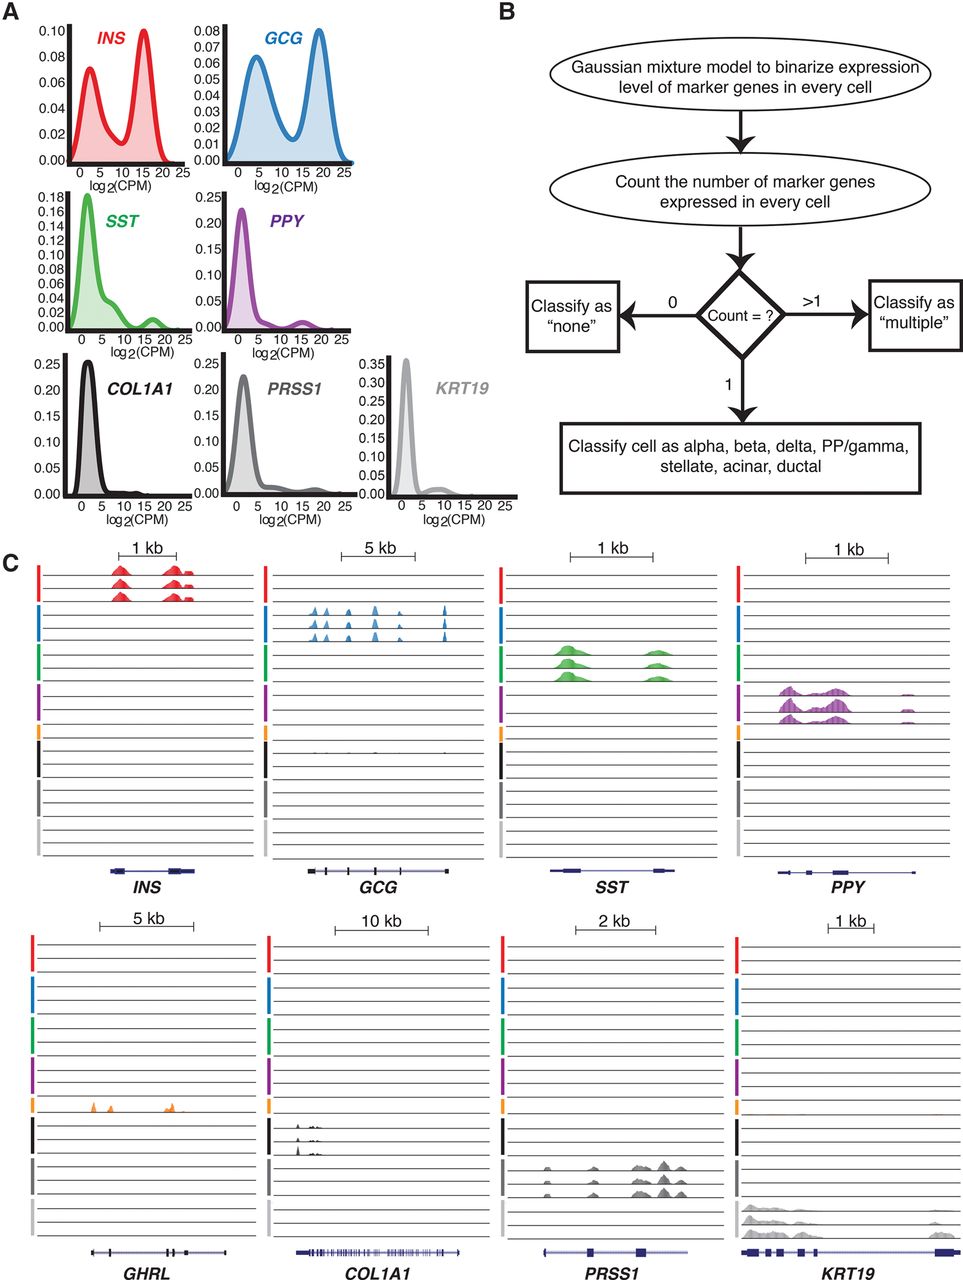
Cell-type classification based on marker gene expression. (A) Density plots demonstrating endocrine and exocrine marker gene expression across all single cells. (B) Schematic of the Gaussian mixture model method applied to assign cell-type identity based on marker gene expression. (C) UCSC Genome Browser views of representative single-cell expression profiles of INS, GCG, SST, PPY, and GHRL genes encoding beta, alpha, delta, PP/gamma, and epsilon cell hormones of the endocrine pancreas, respectively, and marker genes for stellate (COL1A1), acinar (PRSS1), and ductal (KRT19) cells of the exocrine pancreas. Line colors indicate putative beta (red), alpha (blue), delta (green), PP/gamma (purple), epsilon (orange), stellate (black), acinar (dark gray), and ductal cells (light gray). (PP) pancreatic polypeptide; (CPM) counts per million.


