
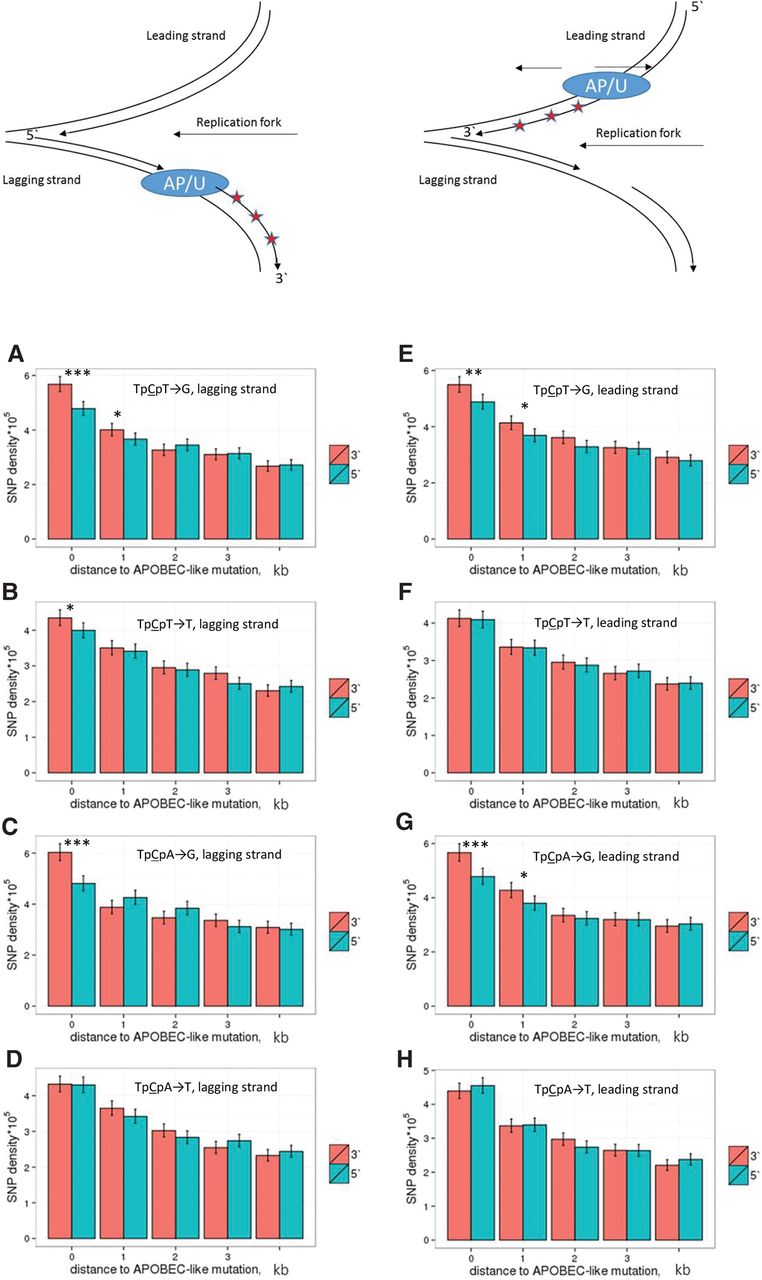
Figure 5.
Density of linked SNPs 5′ and 3′ of a TpCpW→K mutation. In the schematic depiction of a replication fork at the top of the figure, red asterisks correspond to de novo mutations, and AP/U is the position of the TpCpW→G mutation interpreted as the position of the abasic site or the position of the TpCpW→T mutation interpreted as the position of the uracil. The rate of mutations on the lagging (A–D) or the leading (E–H) strand is measured in five nonoverlapping 1-kb windows at increasing distance from the TpCpW→K SNPs. (***) P < 0.001; (**) P < 0.01; (*) P < 0.05 (χ2 test).


