
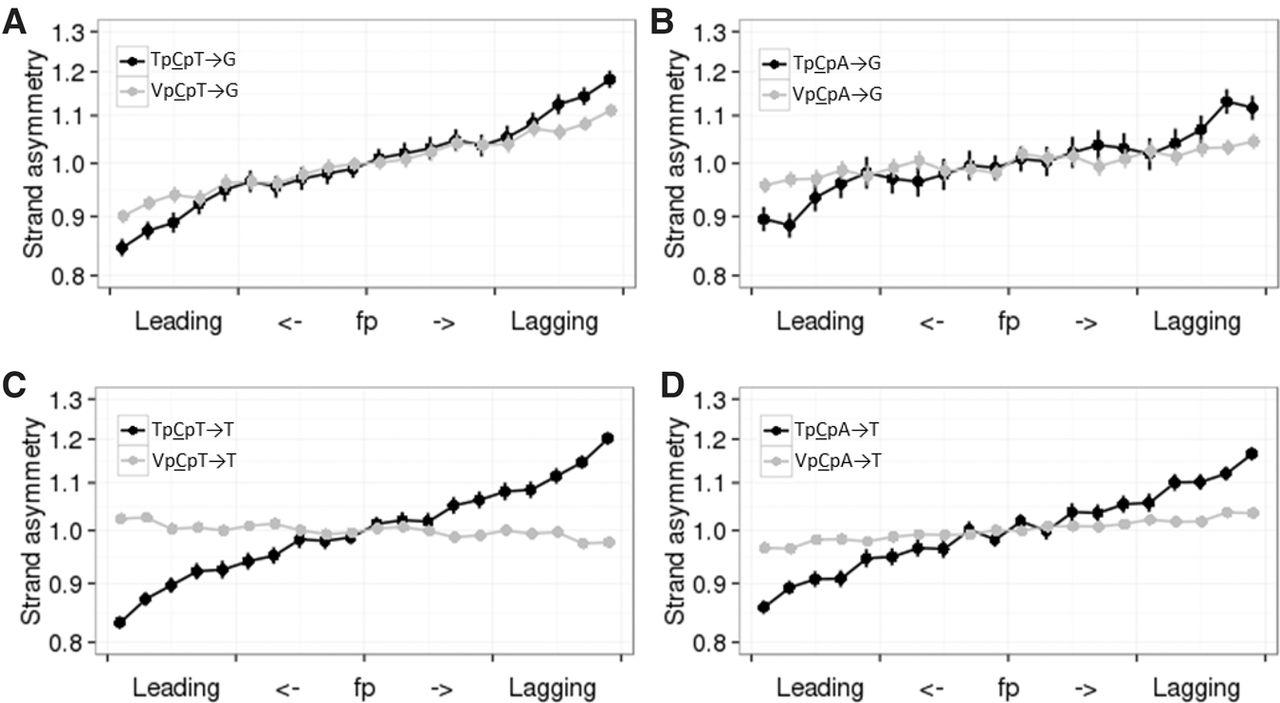
Figure 1.
Mutations in different APOBEC3A/B contexts are more frequent on the lagging strand (A–D). Horizontal axis indicates the propensity of the region of the DNA strand to be replicated as lagging or leading; vertical axis, ratio of the frequencies of the two complementary mutation types on the strand in this category. Vertical bars represent 95% confidence intervals. V corresponds to A, C, or G.


