
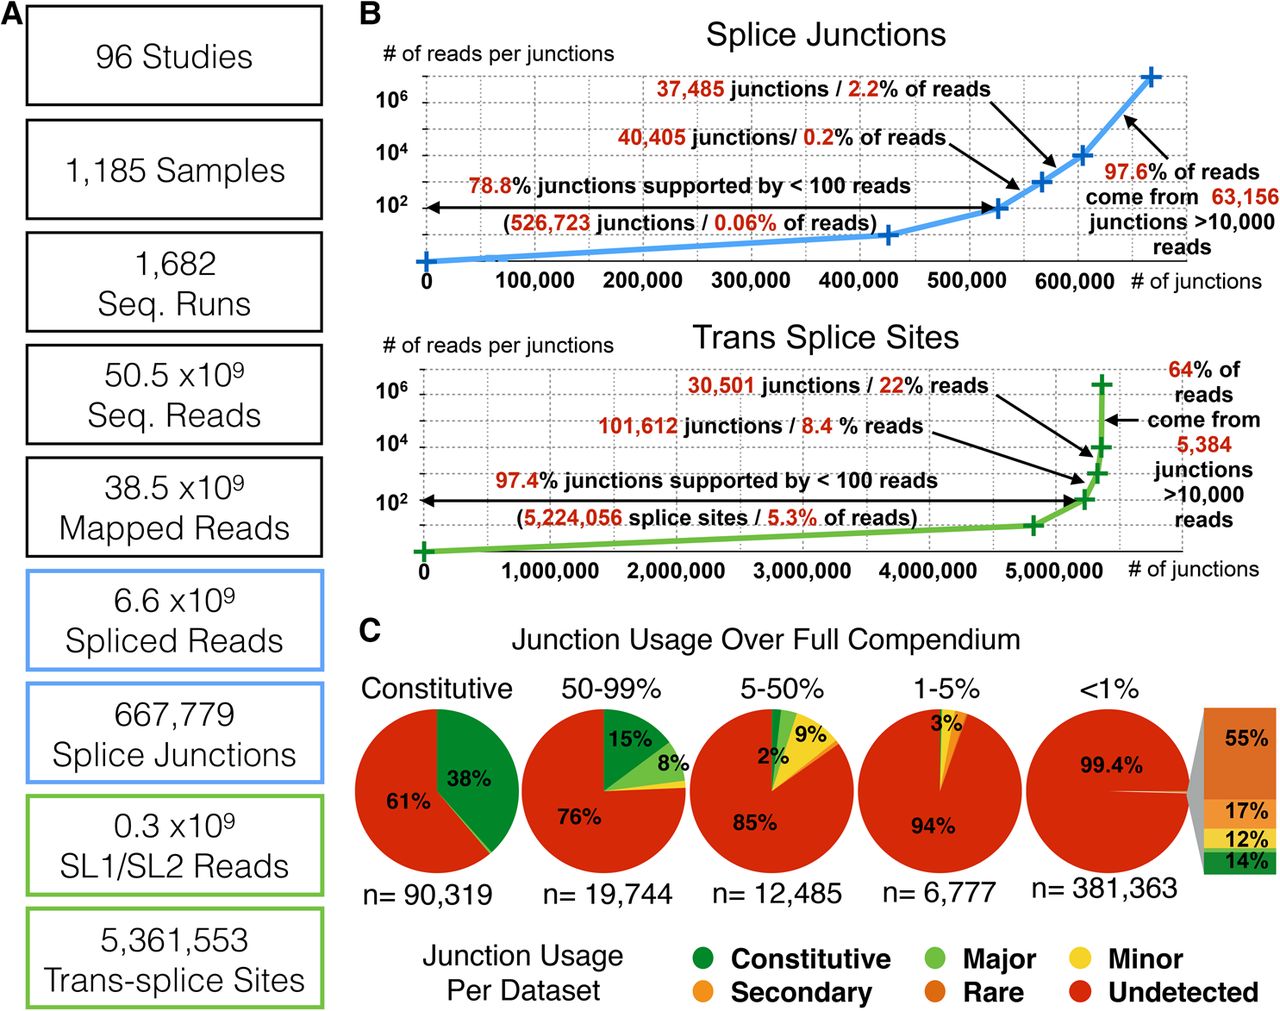
(A) Relevant figures regarding the compendium data set used in this study. (B) Distribution of sequencing reads spanning individual exon/exon (top), or splice leader (SL)/exon junctions (bottom). (C) For each splice junction, we measured a usage frequency over the whole compendium (see Methods) and assigned it to a usage category (>99%: constitutive; 50%–99%: major; 5%–50%: minor; 1%–5%: secondary; <1%: rare). We then evaluated for each junction what its usage frequency was in each of the individual 1682 RNA-seq runs. The distribution within each category is represented as pie charts. The breakdown of junctions with a frequency <1% found “nonrare” in individual sets is shown as a stacked graph (see also Supplemental Table 2).


