
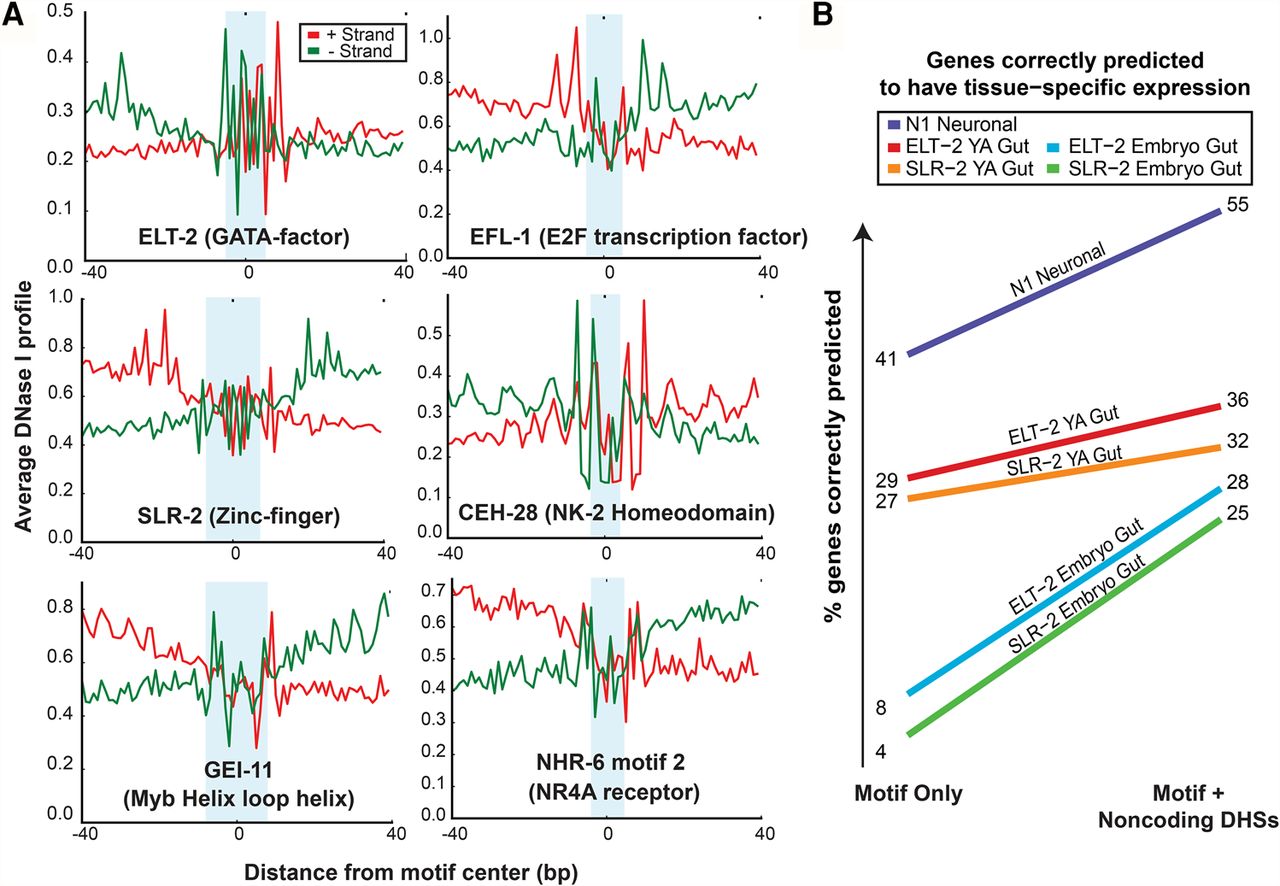
Using DNase-seq to refine prediction of tissue-specific expression by TF motifs. (A) Average DNase profile over C. elegans motif sites. C. elegans motif sites show patterns of DNase cleavage accessibility and strand-shift in reads characteristic of TF footprints. Average DNase profile is measured across 80 bp centering around the motifs (from 2 kb upstream of genes). Positive (red) and negative (green) strands are shown. Light blue shading shows the position of each motif: ELT-2, EFL-1, SLR-2, CEH-28, GEI-11, and NHR-6 motif 1. (B) Refining prediction of tissue-specific gene expression with noncoding DHSs. The percentage of genes correctly predicted to be expressed in the tissue expression data set from the presence of DNA motif (motif only) was compared with the presence of DNA motif within noncoding DHSs (motif + noncoding DHS). Using noncoding DHS data improves prediction accuracy of intestinal expression (embryonic FACS data from Spencer et al. 2011) from 8% to 28% (ELT-2; blue) and 4% to 25% (SLR-2; green). Similarly, using noncoding DHS data also slightly improves prediction of expression in young adult (YA) dissected intestines (data from McGhee et al. 2007) from 29% to 36% (ELT-2; red) and 27% to 32% (SLR-2; orange). Using noncoding DHS data also improves prediction of neuronal expression (Spencer et al. 2011) by N1 neuronally enriched motif from 41% to 55% (purple).


