
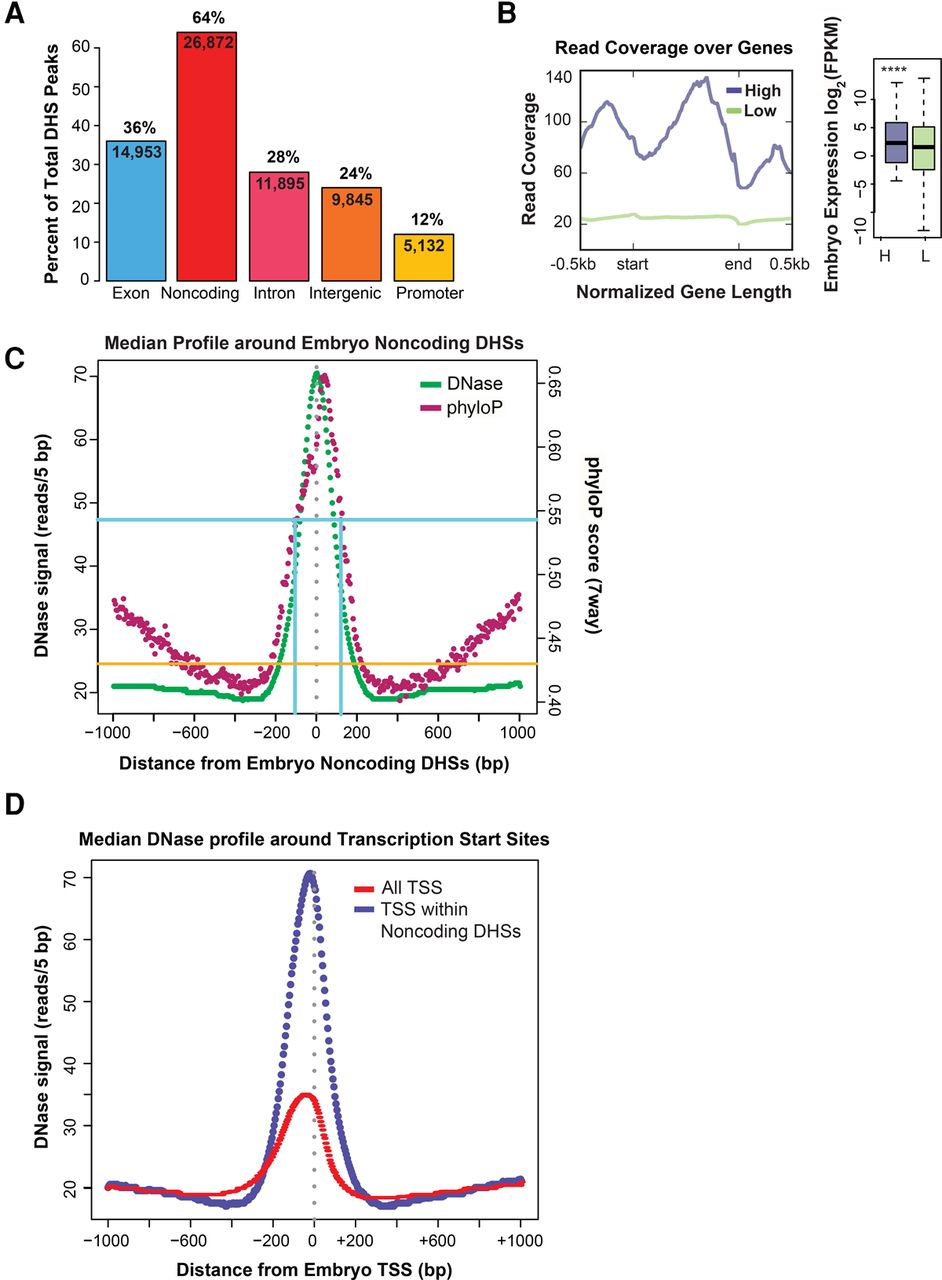
Noncoding DHSs are highly conserved and accessible to DNase. (A) Noncoding DHSs are abundant in the embryo. Embryo DHSs were annotated according to position relative to WormBase WS241 protein-coding genes: exons (blue) and noncoding (red). Noncoding DHSs are further subdivided into introns (pink), promoter (defined as <300 bp 5′ of ATG; yellow), and intergenic (orange) regions. (B) Protein-coding genes with higher DNase accessibility have higher expression. Read coverage (Total DNase signal across biological replicates) was measured for length-normalized protein-coding genes and 1 kb of surrounding sequence. k-means clustering of genes by read coverage was used to find genes with higher (high) and lower read coverage (low). Embryo expression (measured in log2 of FPKM from Zhong et al. 2010) was compared between higher (H) versus lower (L) read coverage genes. (C) Embryo noncoding DHSs are highly conserved and highly accessible to DNase. Median DNase signal (green; measured in 5-bp windows) and phyloP sequence conservation score (pink; seven-way) are measured across 2 kb of sequence centering around embryo noncoding DHSs. Read coverage maximizes at 70.5 reads in a 5-bp window and phyloP sequence conservation at 0.66. In comparison, phyloP conservation is 0.54 (blue) for known true positive lin-39/ceh-13 (Kuntz et al. 2008) and is 0.43 for negative control nonenhancer regions (orange line). (D) Median DNase signal peaks at C. elegans transcription start sites (TSS) and shows a 5′ bias. Median DNase signal (measured in 5-bp windows) is measured across 2 kb of sequence centering around embryo TSS (locations from Chen et al. 2013), with 5′ to 3′ shown from left to right (following the direction of transcription). Center of the TSS is by gray dotted line. DNase signal peaks at All TSS (red) and at TSS within noncoding DHSs (purple) and shows strongest DNase accessibility just 5′ to the TSS.


