
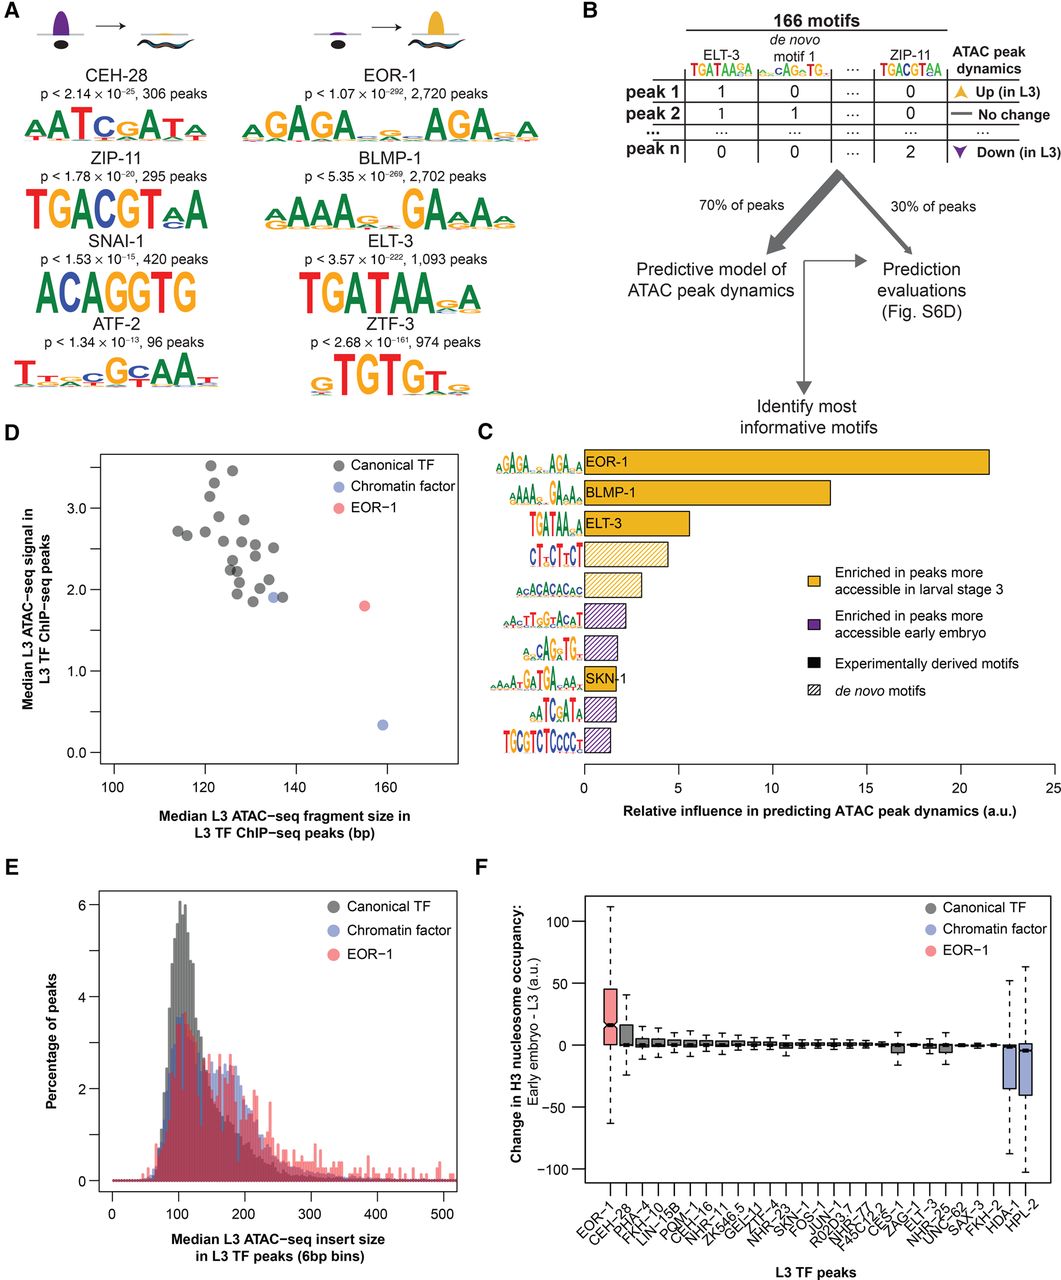
Motifs associated with increases in chromatin accessibility during development reveal key transcription factors with unique binding loci. (A) ATAC-seq peaks which decreased (left) or increased (right) accessibility between early embryo and L3 are enriched for previously identified transcription factor binding motifs; P-values are Benjamini-Hochberg-corrected for multiple hypothesis testing. (B) The number of instances of previously identified as well as de novo motifs (see Supplemental Fig. S6C) in each consensus ATAC-seq peak were used as features in a machine learning model to predict how each ATAC-seq peak changed between early embryo and L3 (increasing, decreasing, or no change). A training set (70% of all ATAC-seq peaks) was used to build the model, while the remaining held-out testing set was used to assess model quality (see Supplemental Fig. S6D). (C) The relative influence of every motif from the machine learning model in Figure 4B was quantified. Solid bars are previously defined motifs, while hashed bars are de novo identified motifs in dynamic ATAC-seq peaks. (D) The median L3 ATAC-seq signal and fragment length at the midpoint (±50 bp) of L3 ChIP-seq peaks; box plots of the same data are in Supplemental Figure S7C,D. (E) Histograms of L3 ATAC-seq fragment size at the midpoint (±50 bp) of L3 ChIP-seq peaks were calculated and normalized to percentages. Canonical TFs and chromatin factors were then aggregated and plotted. (F) The change in H3 nucleosome occupancy between early embryo and larval stage 3 at the midpoint of each L3 transcription factor ChIP-seq peak was calculated using DANPOS (Chen et al. 2013b) and publicly available H3 ChIP-seq.


