
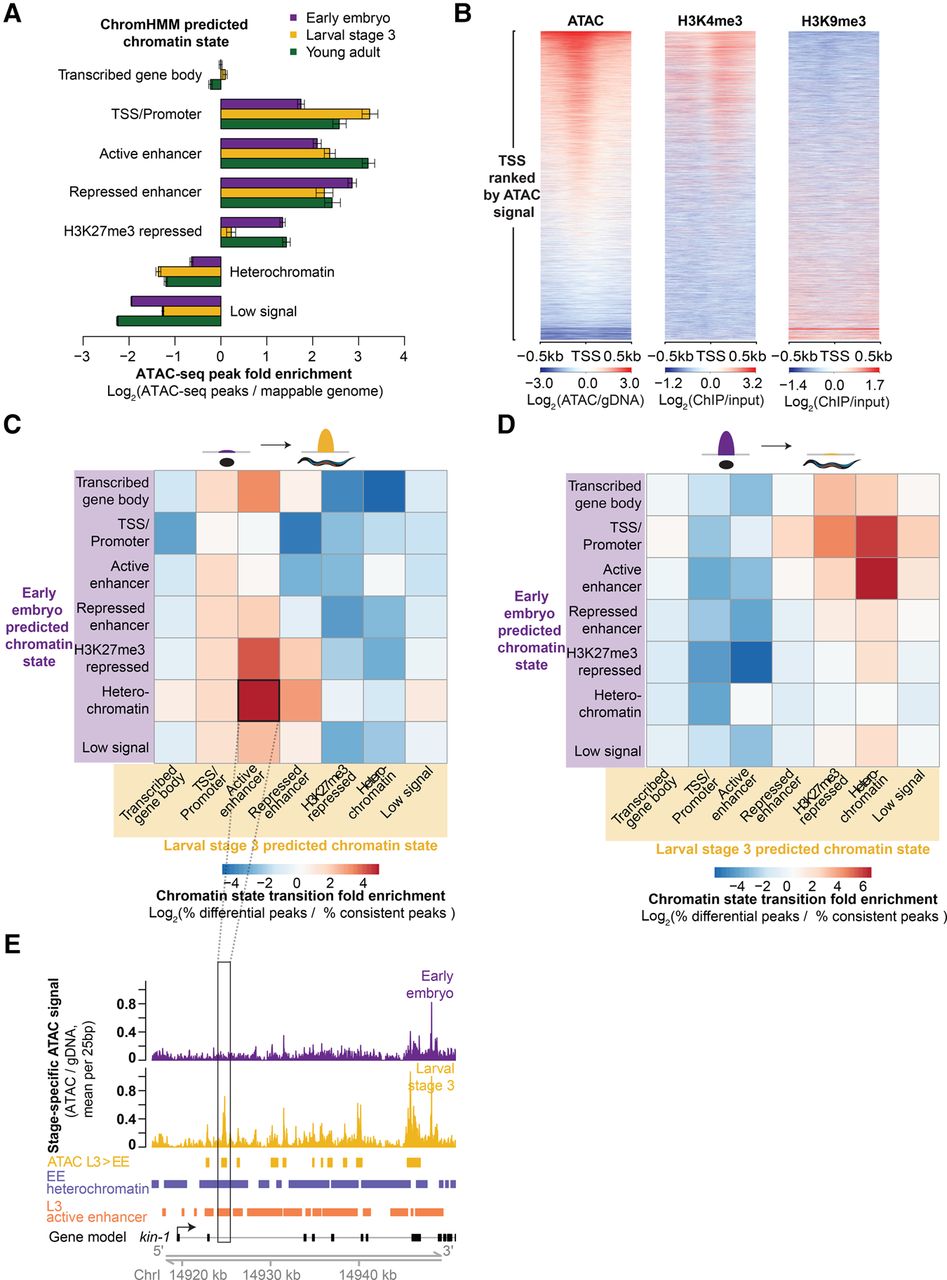
ATAC-seq as a single assay describes the epigenome. (A) Enrichment of stage-specific ATAC-seq peaks in ChromHMM-predicted chromatin states relative to values expected by chance; significance derived via 10,000 bootstrapping iterations, and error bars reflect 95% confidence intervals (P ≤ 1 × 10⁻⁴, except for early embryo transcribed gene body [P = 0.633]). The decrease in enrichment of ATAC-seq peaks in H3K27me3-repressed regions in L3 compared to young adult and early embryo is likely due to the low sequencing depth of the L3 H3K27me3 ChIP-seq. (B) Larval stage 3 (L3) ATAC-seq signal at 19,899 previously defined transcription start sites (TSS ± 0.5 kb) is correlated with active histone modifications (H3K4me3) and anti-correlated with heterochromatin (H3K9me3) around the TSS. (C,D) Regions that increase in accessibility in ATAC-seq peaks are enriched for transitions from inactive chromatin states to active regulatory states (C), while regions that decrease in accessibility are enriched for transitions from active regulatory states to inactive chromatin states (D). (E) An example of an increase in chromatin accessibility overlapping with a transition from heterochromatin to a predicted active enhancer chromatin state. Multiple TSSs have been noted for kin-1, but only the 5′-most is shown here for ease.


