
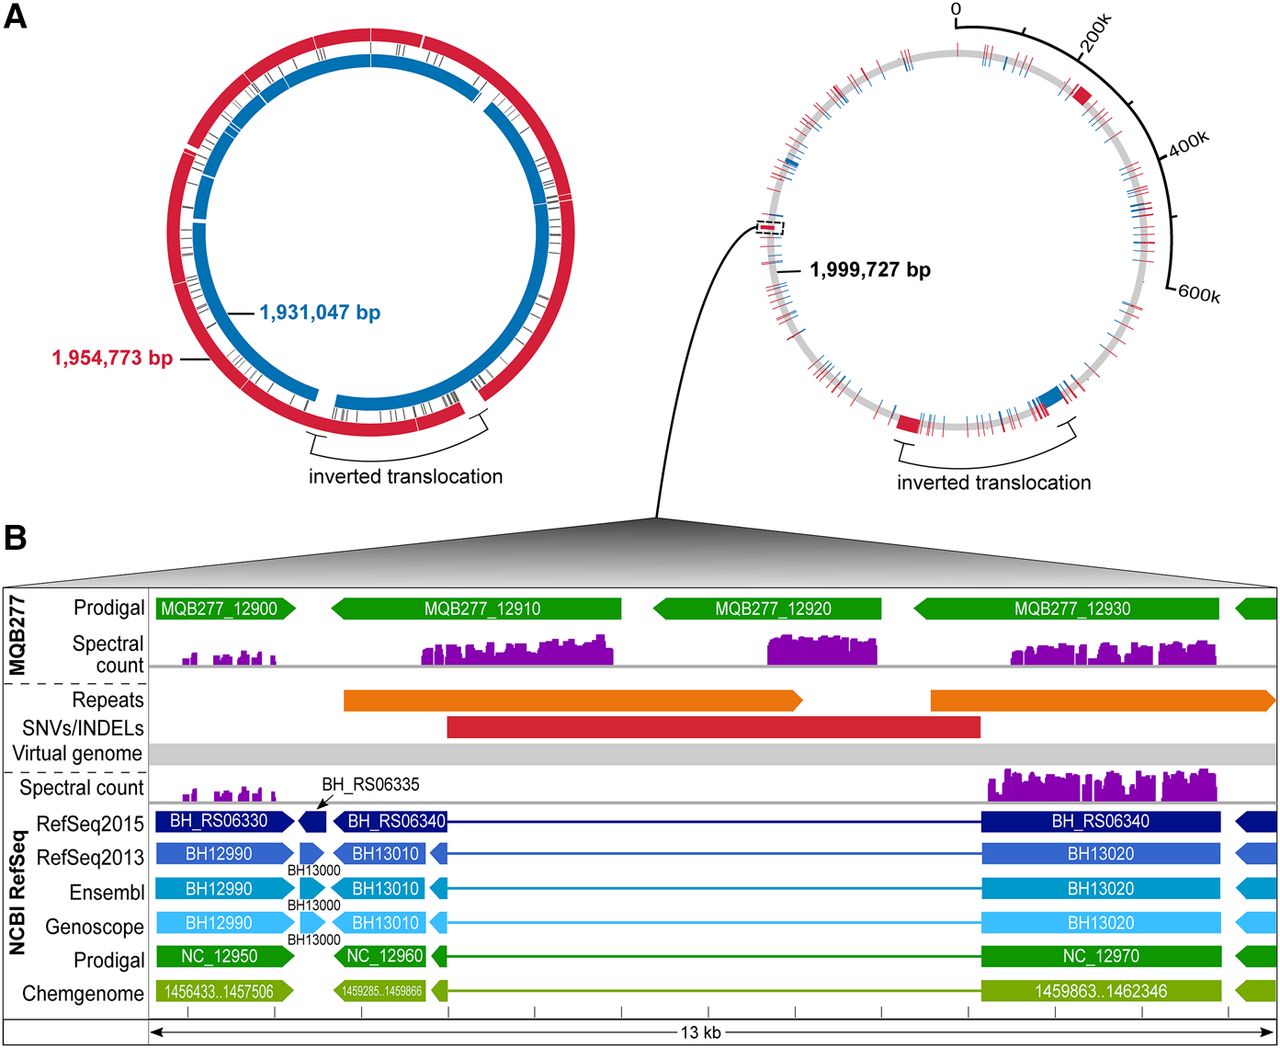
Comparative analysis in the context of experimental data. Integrated visualization of two closely related genomes through a virtual genome concept. (A) On the left, the Bhen NCBI RefSeq genome (inner blue circle) is aligned to our de novo assembly (outer red circle). A large inversion-translocation (black bracket) is marked; several insertions or deletions in either genome are shown (white spaces) and a center track for single nucleotide variations (SNVs). To the right, the virtual genome (gray) is shown which incorporates both genome sequences, including all differences, into a common coordinate system. Unique sequences are shown in blue or red (the inversion-translocation present in both genomes is left as is). (B) Zoom into the region harboring a 6088-bp insertion in MQB277 (red bar), showing annotations for the RefSeq genome (below the virtual genome track) and assembly (above the virtual genome track), plus experimental proteomics evidence mapped against both genomes (spectral count scaled from 0–800). This region harbors a direct repeat only in the assembly (orange bars). Three CDSs (MQB277_12910, MQB277_12920, MQB277_12930) annotated as autotransporters are highly expressed; the first two (novel CDSs) are only detected (unambiguous 1a peptides) with the correct genome sequence available.


