
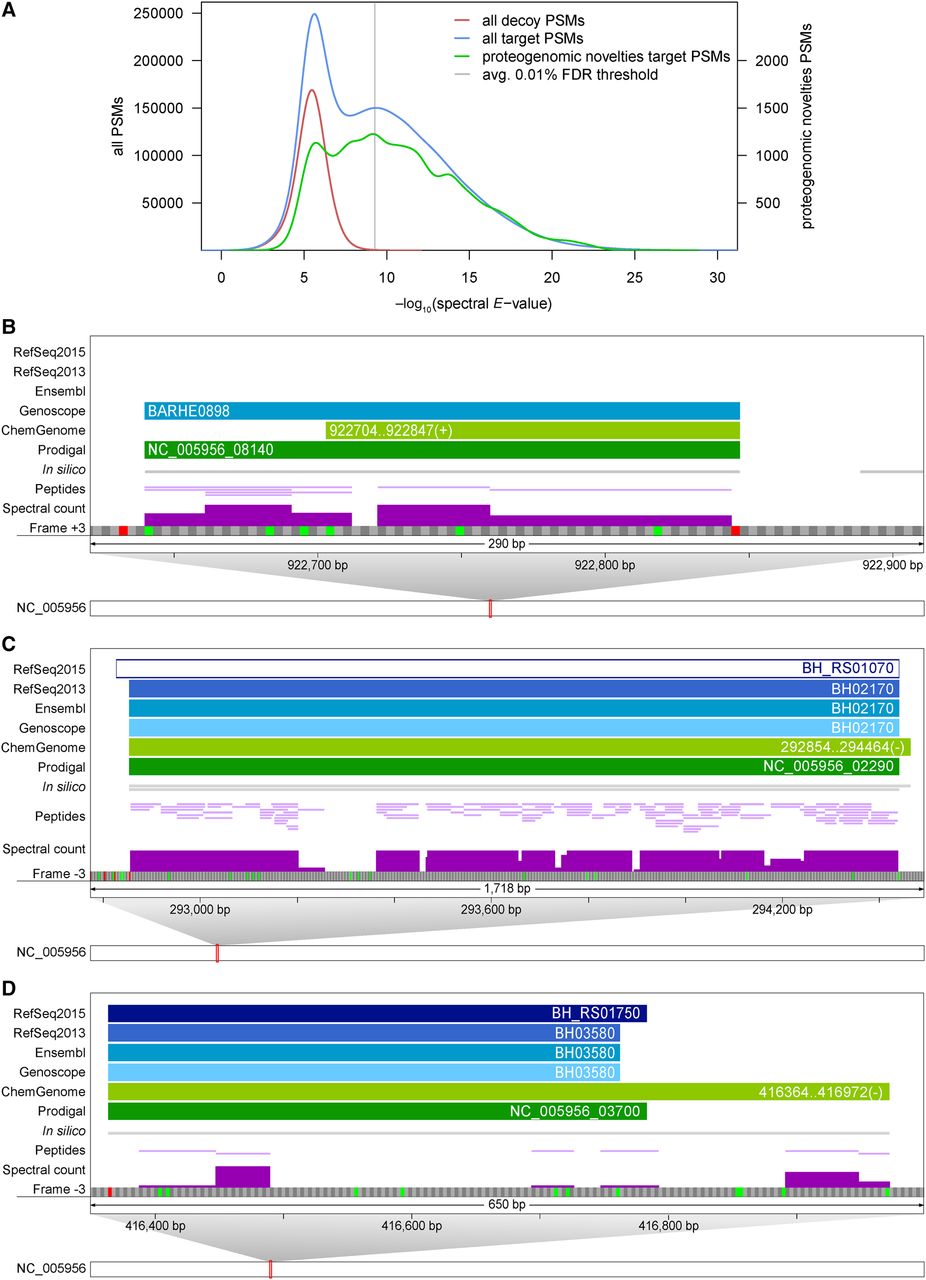
Examples of novel information uncovered by integrative proteogenomics. (A) E-value distribution of PSMs against proteins of decoy and target DB (red and blue lines, left scale) plus the distribution of those PSMs that uncovered novelties (green line, right scale). A PSM level FDR cut-off of 0.01% was selected per sample. (B–D) Zoomed-in views of genomic regions that harbor novelties. For illustration, a single frame of the forward/reverse strand with possible start (green) and stop codons (red) is shown, along with annotations and experimental evidence (spectral counts scaled from 0 to 20). (B) Example of a novel sORF of 68 amino acids (BARHE0898, frame +3). (C) Example of a highly expressed pseudogene (RefSeq2015: BH_RS01070, frame −3); 2244 spectra are mapped to 117 peptides of NusA, which is annotated as a pseudogene in RefSeq2015 for unknown reasons. There is no experimental evidence for the +8-aa N-terminal extension predicted by ChemGenome. (D) Proteomic expression evidence supports a 63-aa-longer proteoform of BH_RS01750 (frame −3) uniquely predicted by ChemGenome.


