
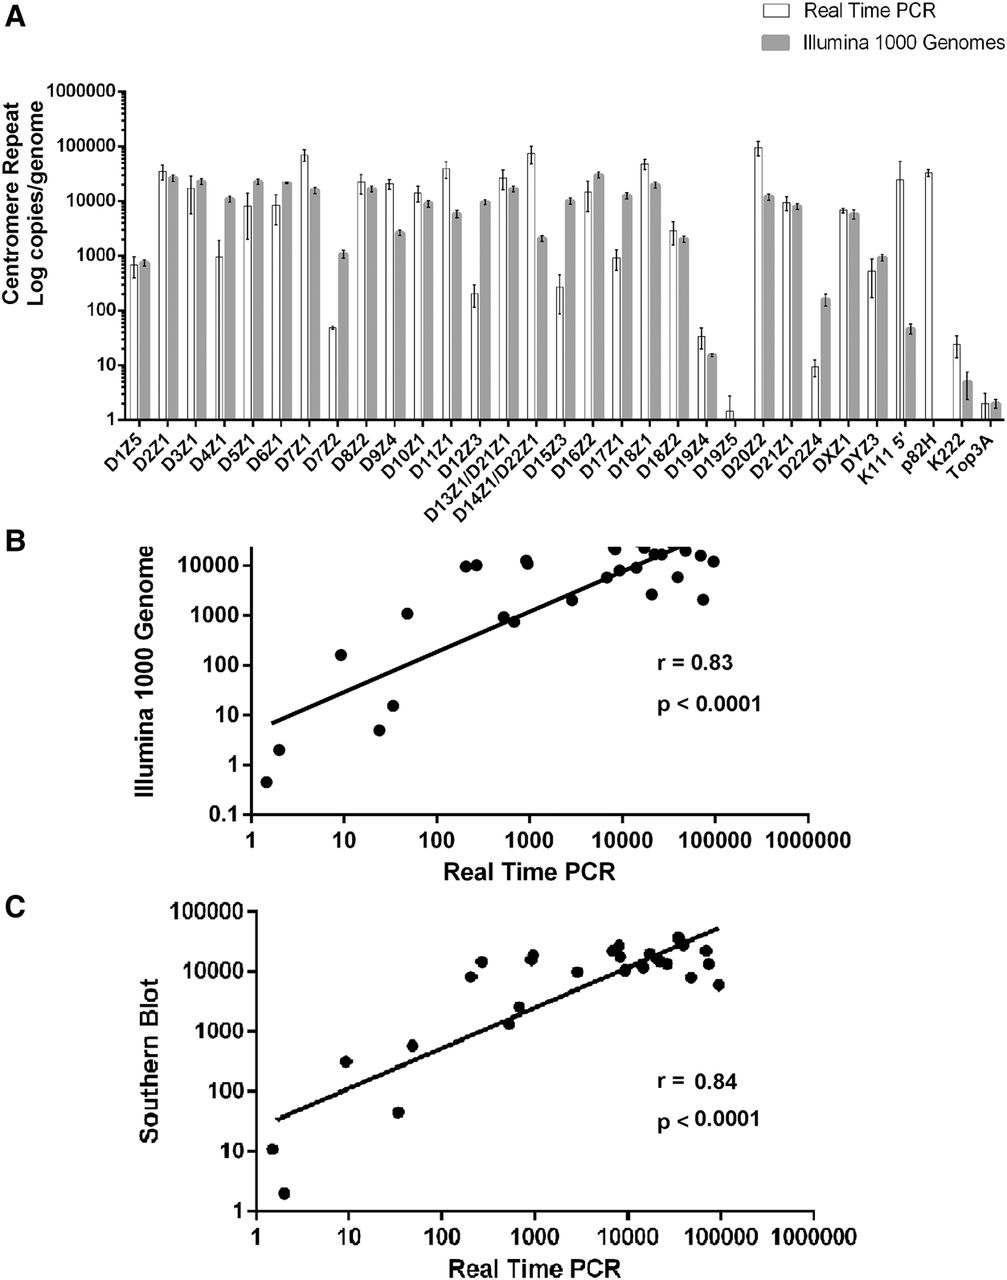
Positive correlation of copy number in each centromeric array as determined by qPCR assays, in silico analysis of The 1000 Genomes Project, and by Southern blotting hybridization. (A) A bar diagram representing the average log copy number of α-repeats in each centromeric array, of pericentromeric proviruses K111 and K222, and of single-copy genes per diploid genome as determined by either qPCR of the DNA from PBLs isolated from five individuals (Supplemental Fig. S6) or by in silico analysis of The 1000 Genomes Project (Supplemental Fig. S7). The error bars in the PCR analyses indicate the variation between the alpha repeat content of the DNA of five individuals, and in the bioinformatics analysis of The 1000 Genomes Project, the error bars show the variation between ethnicities. The average values are shown in Table 1. (B) Correlation of α-repeat copy number in each array, proviruses K111 and K222, and single-copy genes determined by qPCR and our bioinformatics analysis (see also Supplemental Figs. S6, S7). A discordant correlation was found in the number of K111 and p82H copies, meaning that these sequences were detected using PCR assays but not with bioinformatics analysis. We were unable to retrieve all p82H sequences using in silico analysis, either due to the stringency of our analytic parameters or technical limitations to sequencing these loci by Illumina. (C) Correlation of the copy number of α-repeats in each array determined by the qPCR assays to the estimated number reported in the literature. The average values are shown in Table 1. The Pearson's correlation coefficient and the P-value are shown.


