
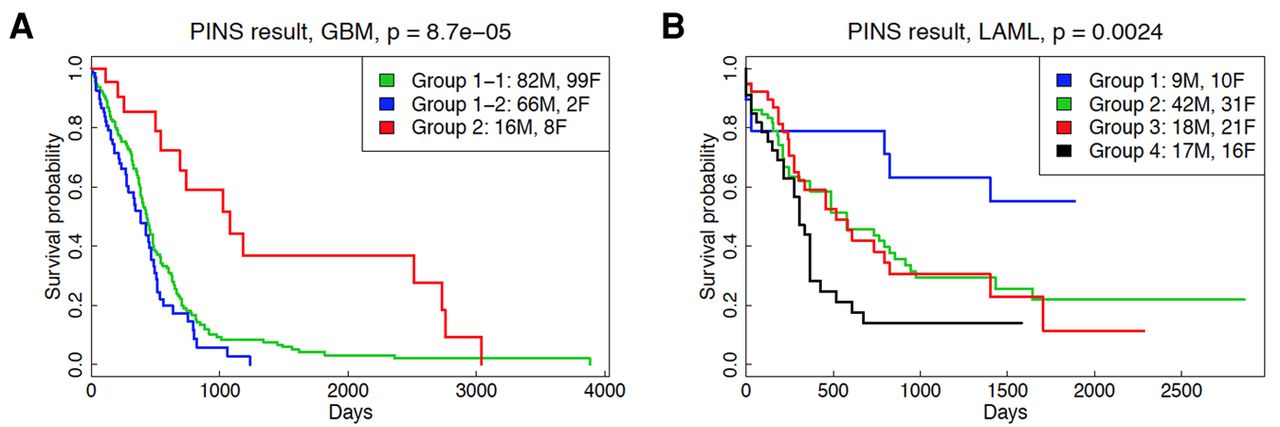
Figure 3.
Kaplan-Meier survival analysis for glioblastoma multiforme (A) and acute myeloid leukemia (B). The horizontal axes represent the time passed after entry into the study, while the vertical axes represent estimated survival percentage.


