
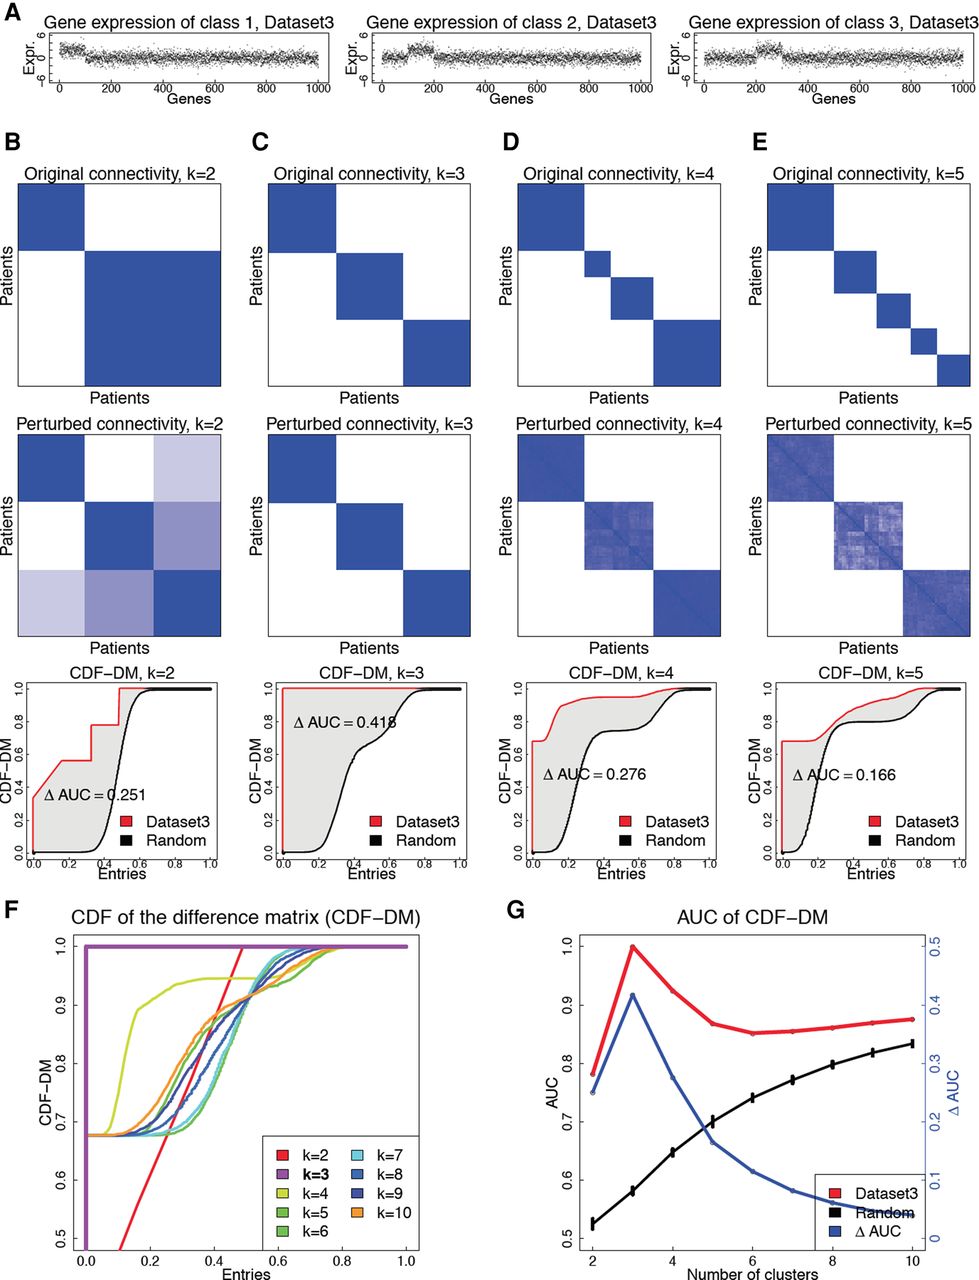
Figure 1.
The PINS algorithm applied on a single data type, using the simulated data named Dataset3. (A) The data set consists of 100 patients and three subtypes, each having a different set of 100 differentially expressed genes. The numbers of patients in each subtype are 33, 33, and 34, respectively. (B–E) Original connectivity matrix (top), perturbed connectivity matrix (middle), and CDF of the difference matrix (bottom) for k = 2, 3, 4, and 5, respectively. (F) CDF of the difference matrix (CDF-DM) for k ∈ [2..10]. (G) AUC values for Dataset3 (red curve), random data (black curve), and the difference (blue) between the two curves.


