
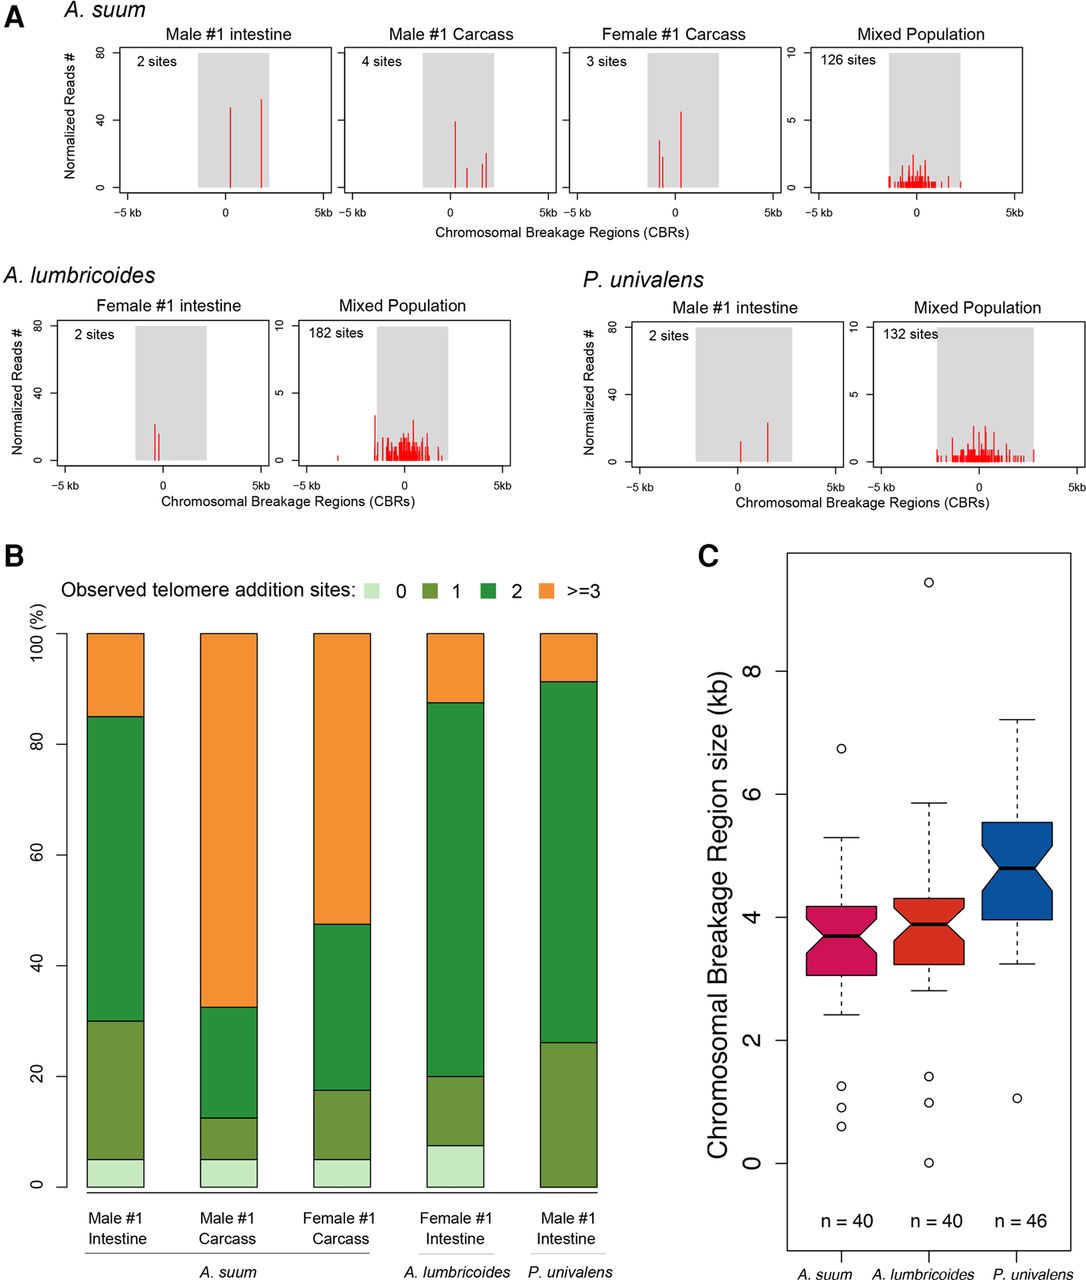
Heterogeneity of telomere addition sites. (A) Telomere addition sites on somatic chromosomes following DNA elimination. A telomere addition site in A. suum (break_a16) and the corresponding telomere addition sites in A. lumbricoides or in P. univalens (break17) are illustrated. The shaded area corresponds to the defined CBRs (determined by the breadth of telomere addition sites at a break in a population of cells), and the red ticks are the frequency and position of the observed telomere addition sites. The center of the CBR is defined as where the highest density of observed telomere addition sites is found in the population. The regions to the left (negative) correspond to retained DNA, while regions to the right (positive) correspond to eliminated DNA. The read frequency was normalized to 50× genome coverage (with 100-bp read length). Note that in an individual there are a limited number of sites that undergo telomere healing. In contrast, in a population, the breadth of telomere addition sites observed is the sum of the independent events in each individual. (B) Compilation of the number of observed telomere addition sites for all 40 breakpoints in Ascaris and 46 breakpoints in Parascaris. (C) Chromosomal breakage region size defined for Ascaris and Parascaris. The region is defined by the extent of all telomere addition sites at a break area.


