
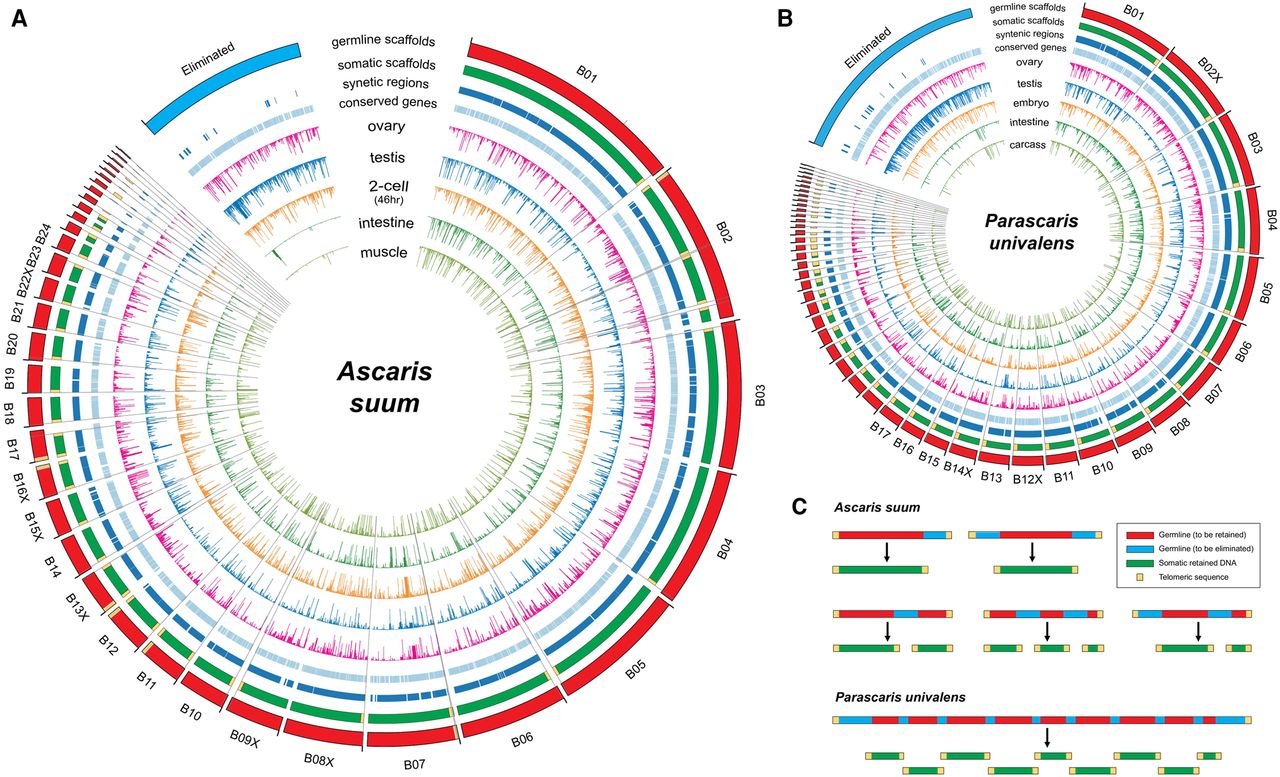
Ascaris and Parascaris programmed DNA elimination genome changes. (A) Breakpoints and eliminated sequences in Ascaris. Illustrated are Ascaris genomic regions (scaffolds) that are partially or completely eliminated (blue in germline scaffold ring). Scaffolds with DNA breakpoints are shown in red within the germline scaffolds ring (the largest outer circle). The positions for the 40 identified DNA break regions are shown as black lines connecting the largest and smallest circles. Genomic regions (scaffolds) eliminated were concatenated for illustration and are shown as a blue block (ring). The somatic scaffolds track indicates the retained somatic sequences. Telomeres are indicated as yellow boxes. Note that all breaks are healed by new telomere addition. The syntenic regions and conserved genes between Ascaris and Parascaris are illustrated in the light blue ring/track. Gene transcript levels (derived from RNA-seq data) for the germline, two-cell embryo, and several somatic tissues are illustrated in the inner circles. Note the high level of RNA expression in the testis corresponding to DNA eliminated regions. In addition, a few of the eliminated genes (six out of 921) appear to be expressed in the soma due to paralogous genes that are retained or to low level contamination of highly expressed germline genes (see Supplemental Text). (B) Breakpoints and eliminated sequences in Parascaris. Presentation is the same as in Figure 3A. Circle plots are not drawn to scale. (C) DNA elimination at the chromosome level in Ascaris and Parascaris (see text).


