
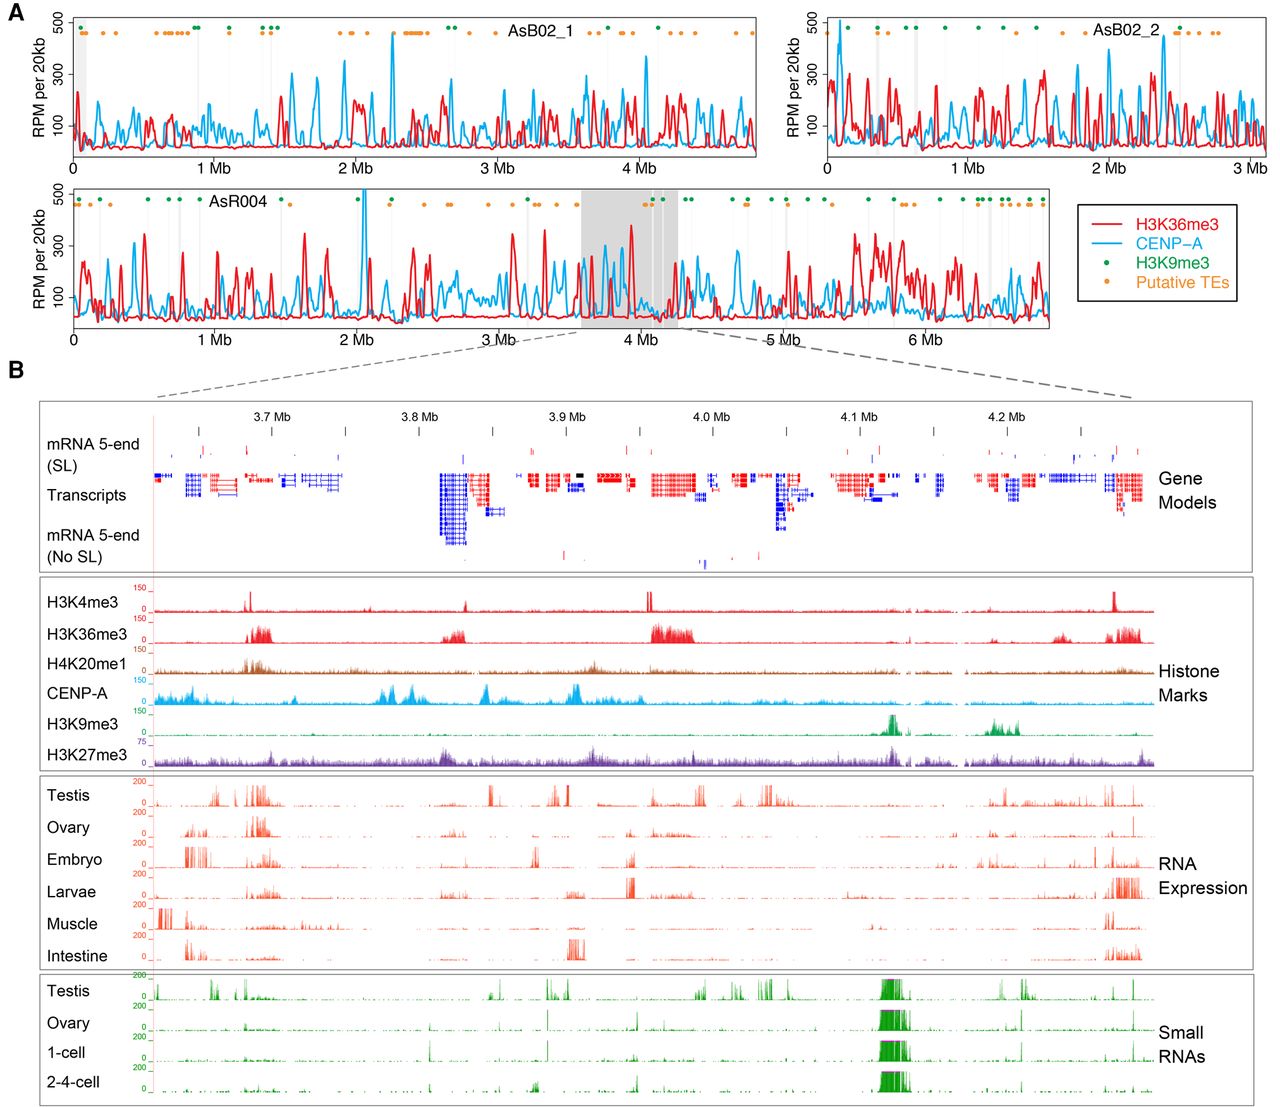
Ascaris chromosome landscapes and genome annotation. (A) Landscape of three Ascaris chromosomes. Illustrated along the length of three assembled Ascaris somatic chromosomes with centromeric regions (defined by CENP-A ChIP-seq; blue), actively transcribed regions (defined by H3K36me3 ChIP-seq; red), heterochromatic regions (defined by H3K9me3 ChIP-seq; green dots), and putative transposon elements illustrated (TEs defined by sequence homology; orange dots). (B) Ascaris genome browser view. An expanded view of the gene models, histone marks, RNA-seq, small RNA data, and 5′ ends of mRNA from the shaded area of chromosome AsR004 in Figure 1A. ChIP-seq data are from 5 d (32–64 cell) embryos. Units for all tracks are normalized to 10× genome coverage (3 Gbp). (SL) spliced leader sequence.


