
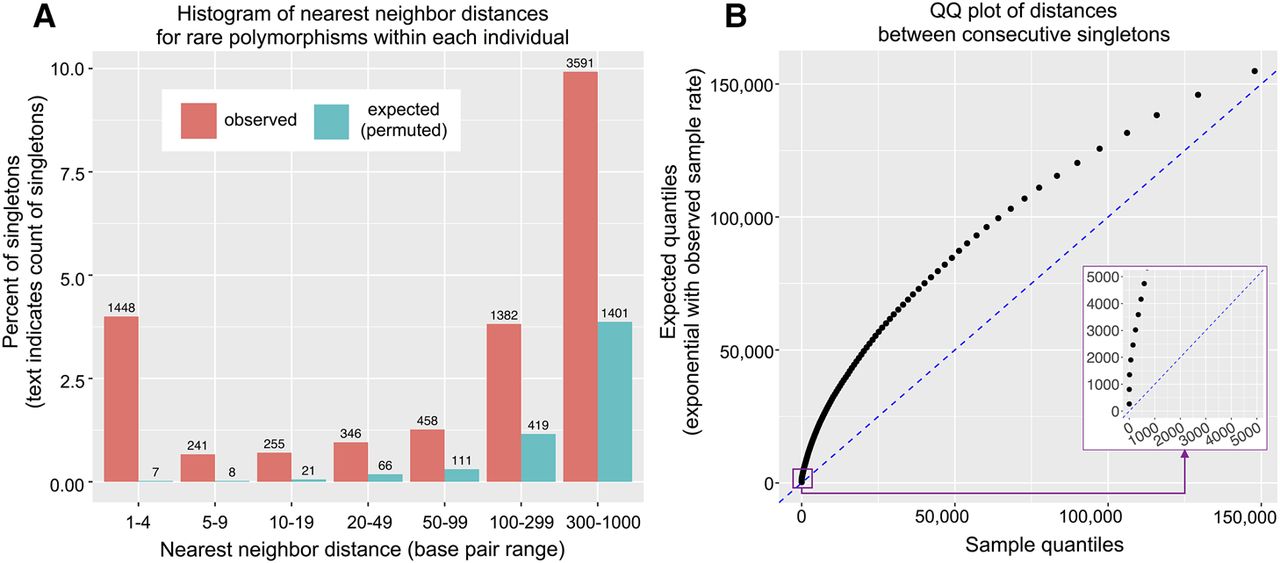
Multinucleotide mutations occur more often than is expected by chance. (A) Histogram of nearest neighbor distance, where every singleton (freq ∼ 1/621) was assigned the distance which was the shorter of the two distances on either side (within a given individual). The expectation is taken from the average of 500 permutations of sample IDs. Note that a 1–4 bp distance corresponds to a cluster of size 2–5 bp. (B) Quantile-quantile plot of distances between consecutive singletons (on both sides of singletons, within an individual), using 1% quantiles (beginning at 0.5%). The expectation is taken from an exponential distribution with a rate equal to the rate within the observed data. The purple inset shows a magnified view of the 0.5%–8.5% quantiles, such that the enrichment of multinucleotide mutations can be seen in the vertically plotted points at the start of the distribution.


