
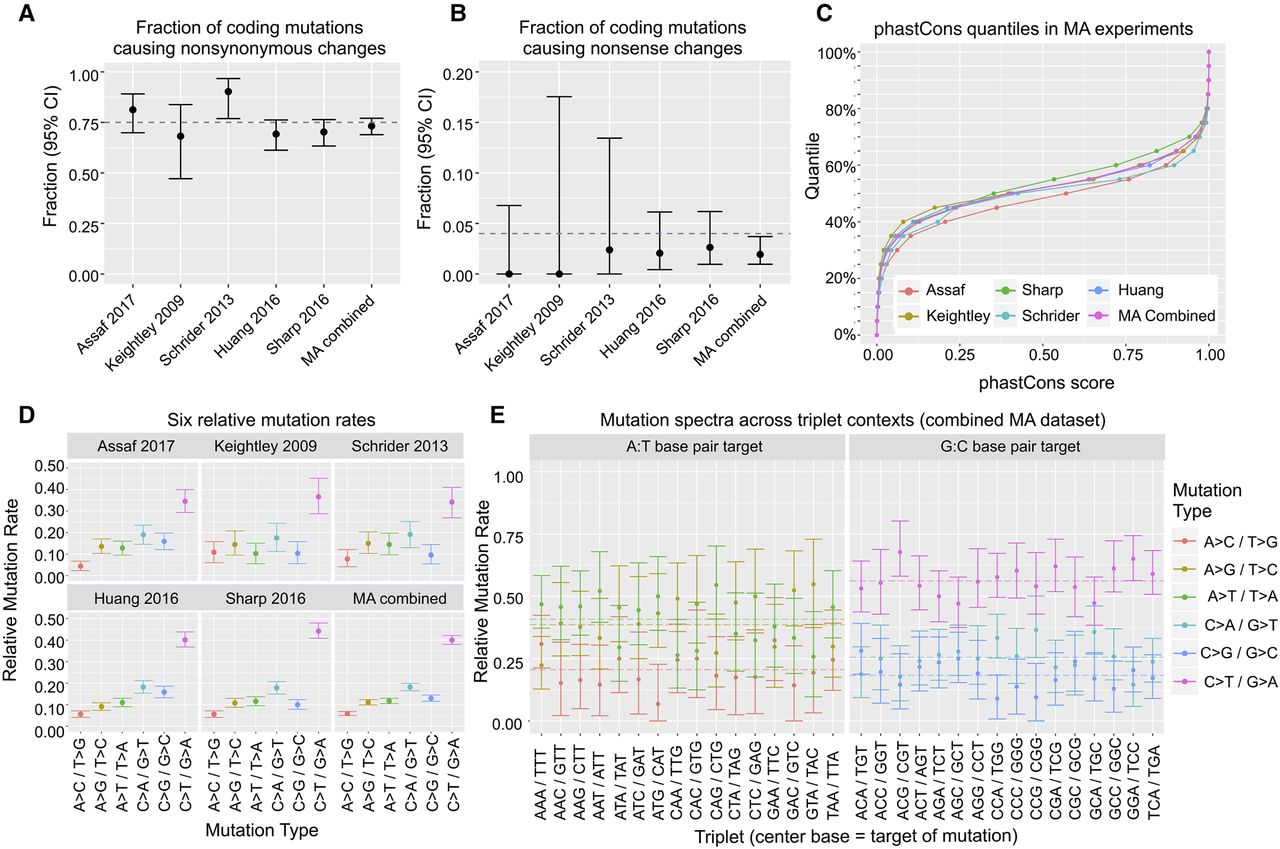
Figure 2.
A summary of comparisons conducted between the five different MA experiments, including (A) the fraction of coding mutations which cause nonsynonymous changes, where the dotted line indicates the neutral expectation of 75%, (B) the fraction of coding mutations which cause nonsense changes, where the dotted line indicates the neutral expectation of 4%, (C) the empirical cumulative distribution for phastCons scores within each MA experiment, (D) the six relative mutation rates (i.e., sum to 1) within all nonrepetitive regions, and (E) the six relative mutation rates calculated across different triplet base contexts, within all nonrepetitive regions.


